Quick Start
Get up and running with Lumen in under 30 seconds.
Installation
Other LLM Providers
For Anthropic, Google Gemini, Mistral, AWS Bedrock, LlamaCpp, and more, see the Installation guide.
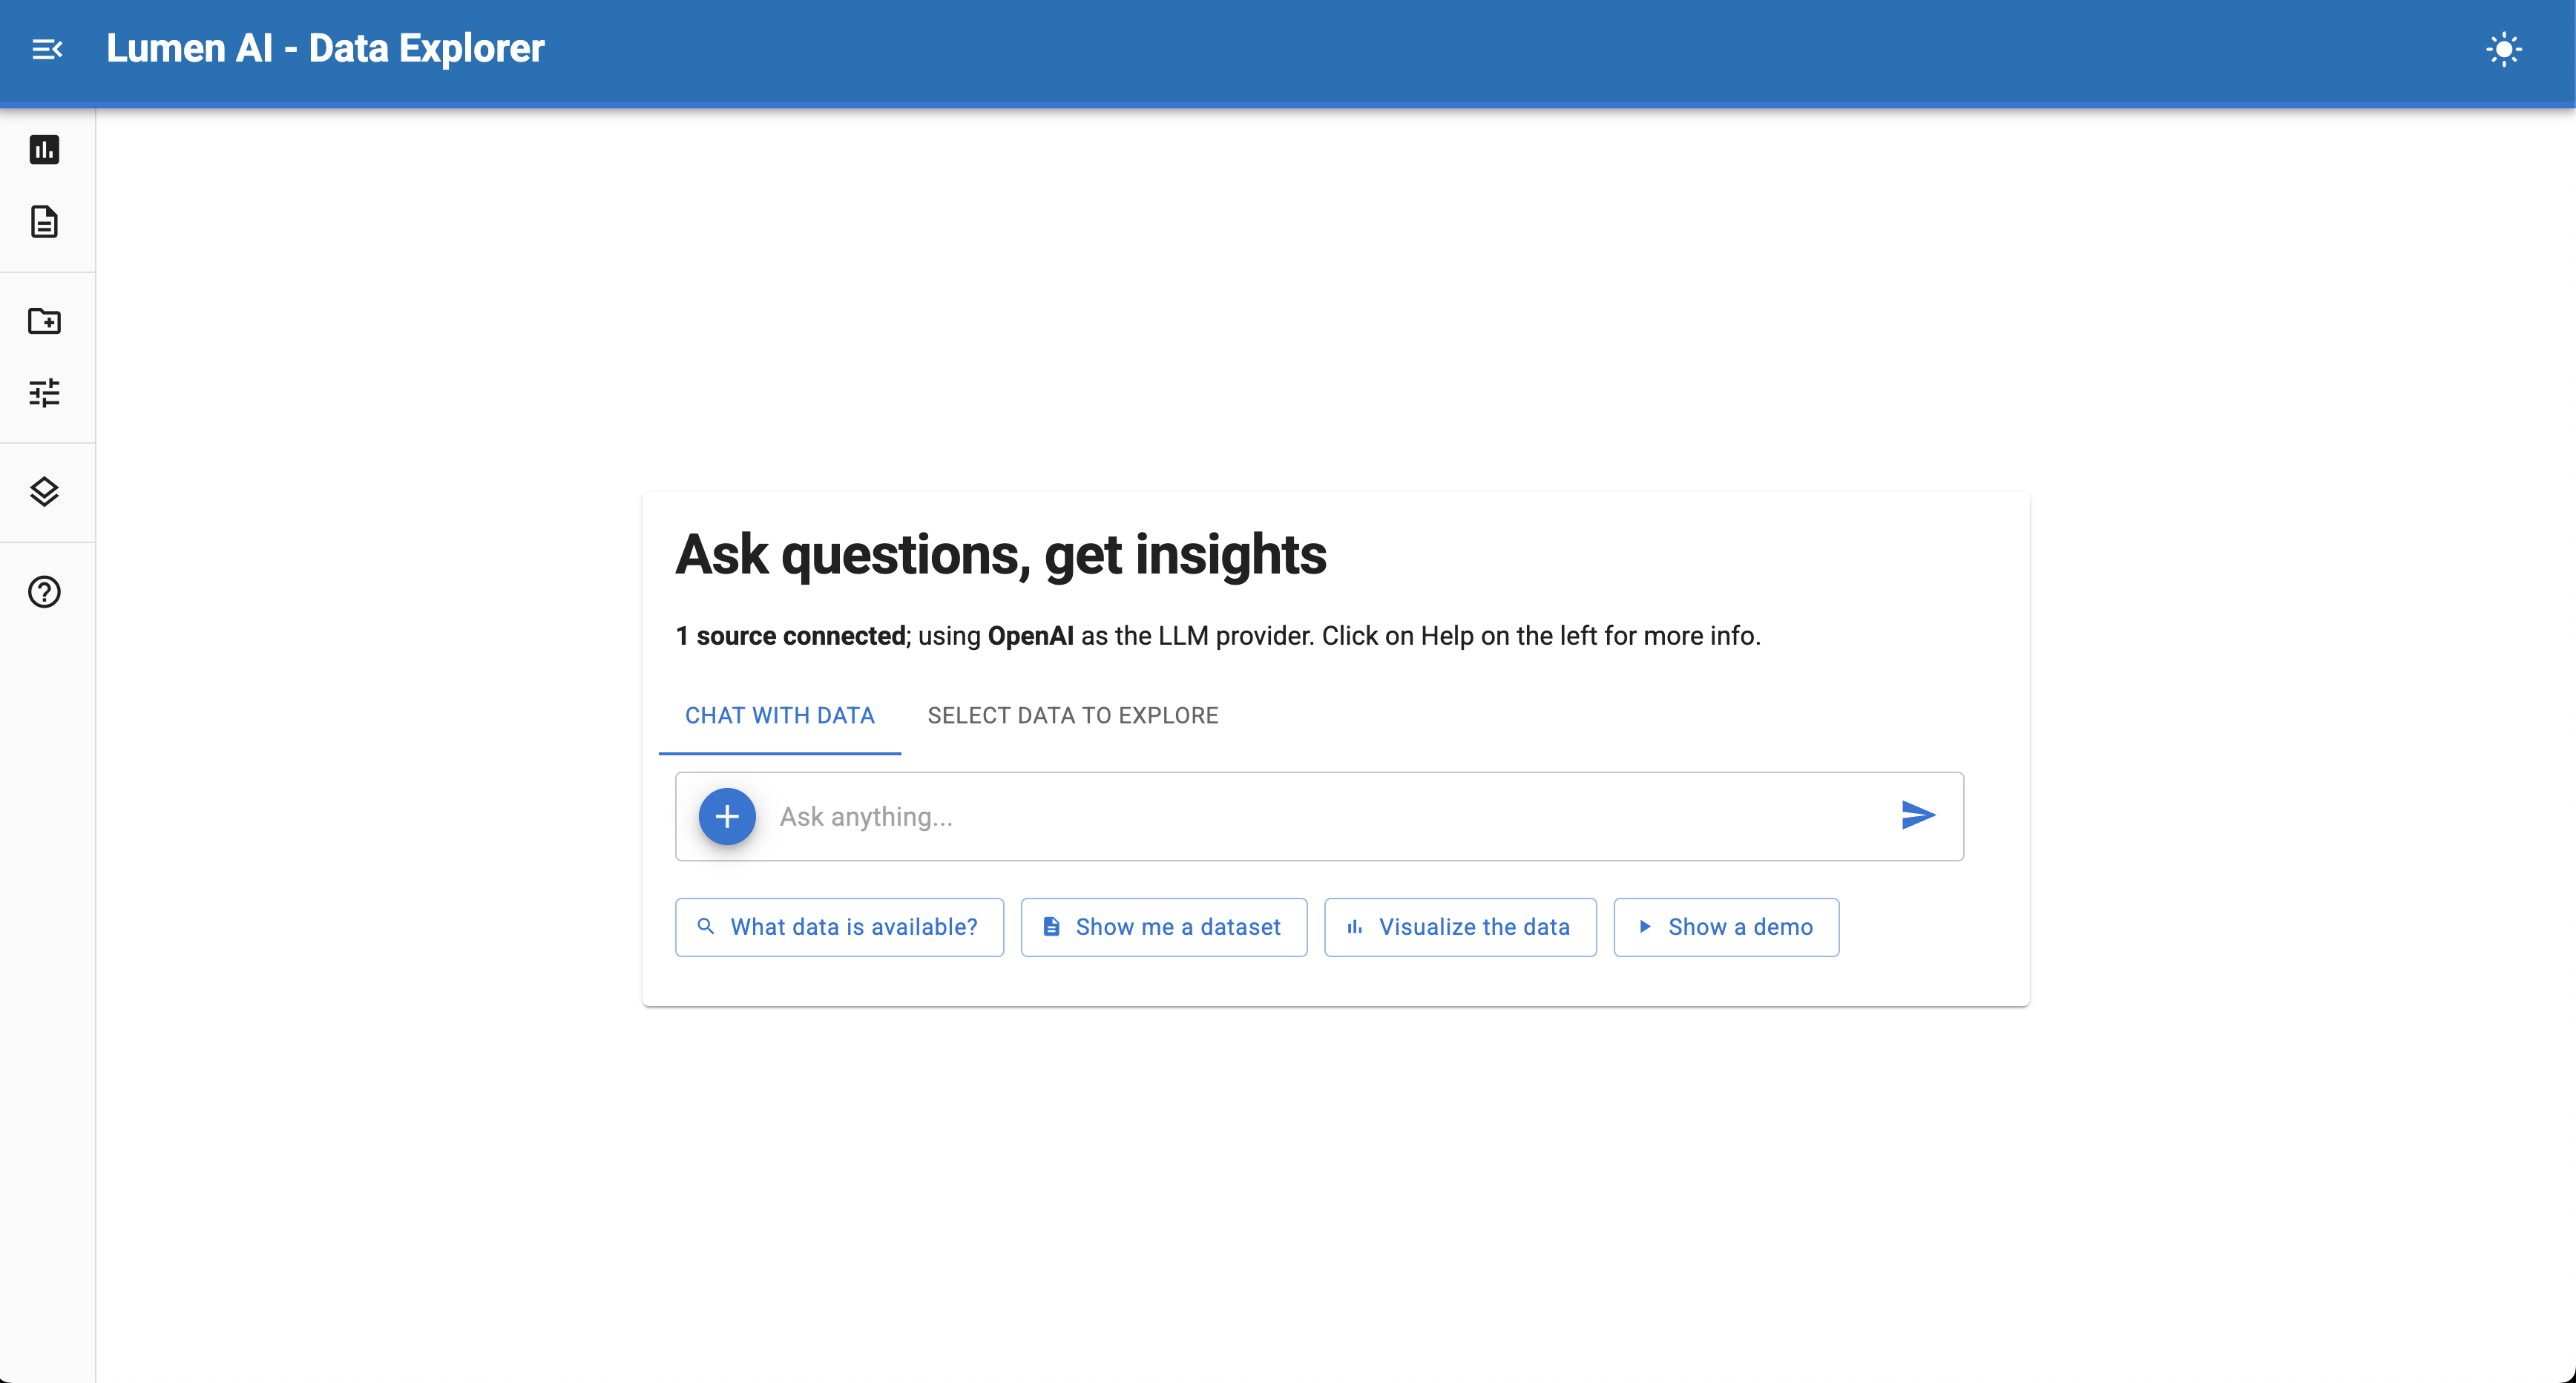
Start Chatting with Data
If a browser tab doesn't automatically open, visit https://localhost:5006 and start chatting with your data.
Try these questions:
-
What datasets are available?
-
Show me a summary of the data
-
Which species has the largest average body mass? Show as a bar chart.
-
Create a scatter plot of bill length vs flipper length, colored by island
-
Filter for penguins over 4kg and show me the distribution by species
How It Works
You don't need to write SQL or Python; just write your request:
Which islands have the most penguins? Plot as a horizontal bar chart.
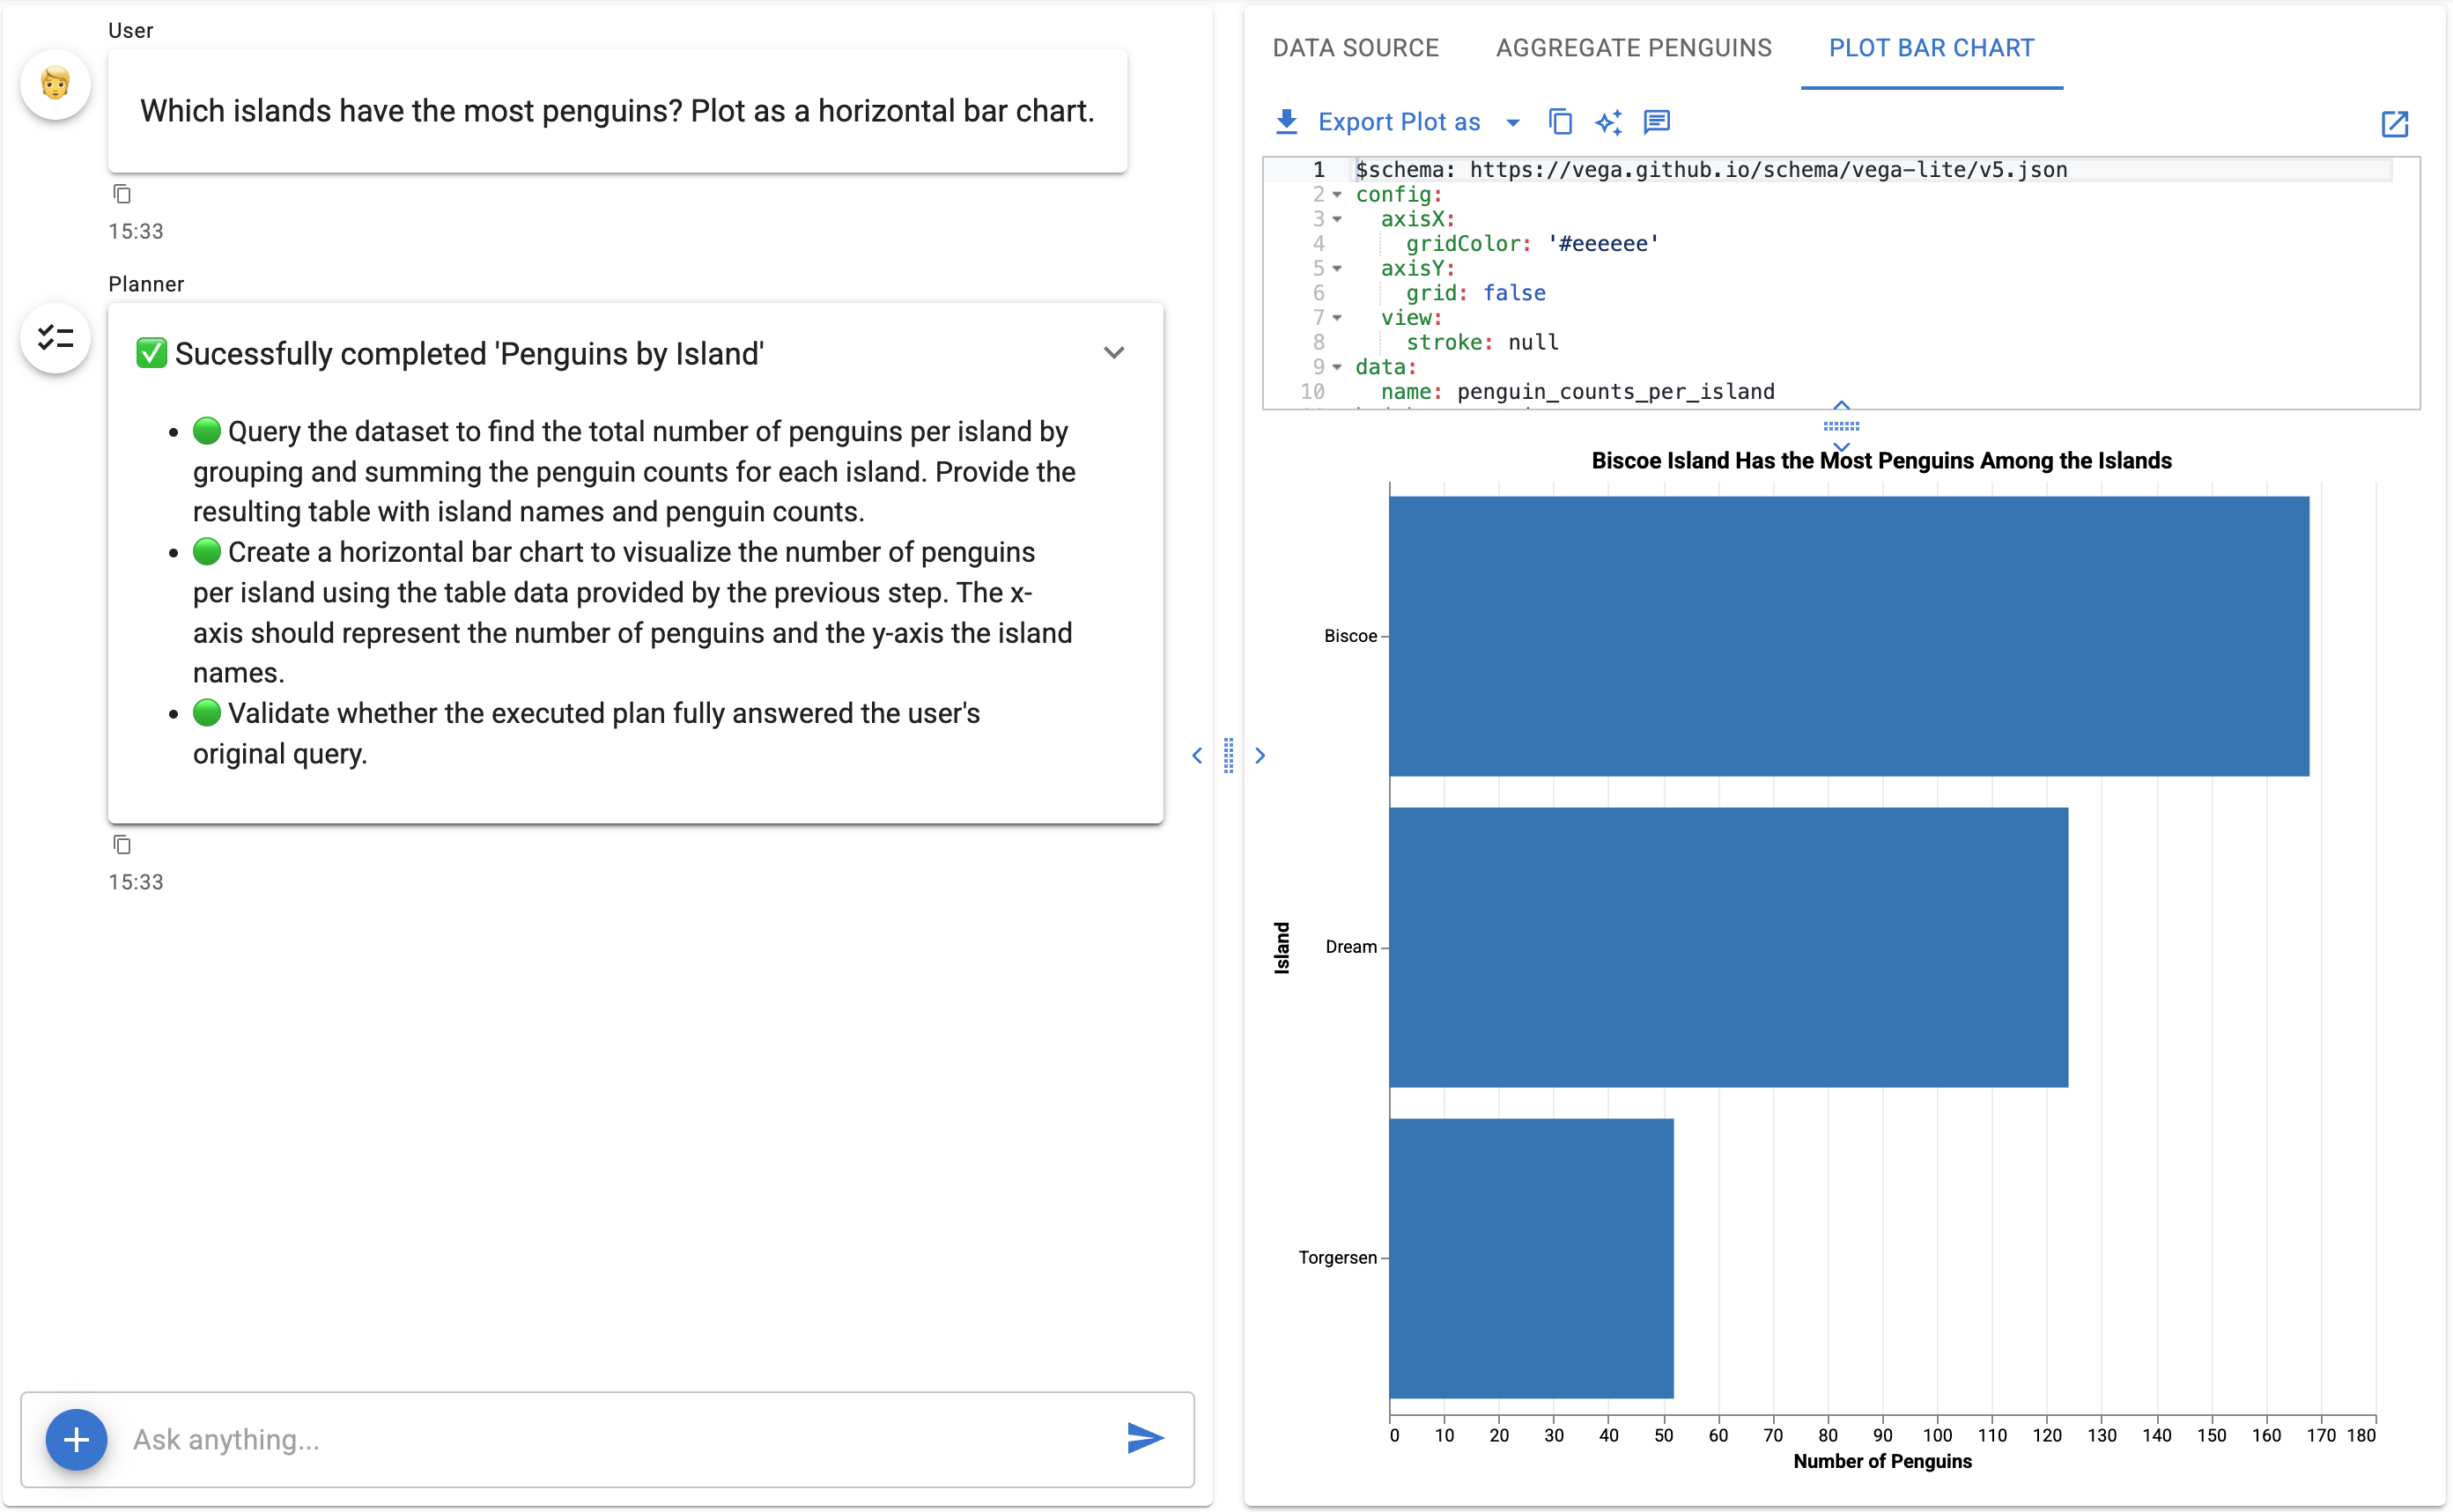
1. Lumen creates a plan:
- 🟢 Query the dataset to find the total number of penguins per island by grouping and summing the penguin counts for each island. Provide the resulting table with island names and penguin counts.
- 🟢 Create a horizontal bar chart to visualize the number of penguins per island using the table data provided by the previous step. The x-axis should represent the number of penguins and the y-axis the island names.
- 🟢 Validate whether the executed plan fully answered the user's original query.
2. Generates SQL to query the data:
SELECT "island", COUNT(*) AS "penguin_count"
FROM penguins
GROUP BY "island"
ORDER BY "penguin_count" DESC
| island | penguin_count |
|---|---|
| Biscoe | 168 |
| Dream | 124 |
| Torgersen | 52 |
3. Creates a Vega-Lite visualization:
$schema: https://vega.github.io/schema/vega-lite/v5.json
data:
  name: penguin_count_by_island
height: container
layer:
- encoding:
    color:
      value: '#4682b4'
    x:
      axis:
        title: Penguin Count
      field: penguin_count
      type: quantitative
    y:
      axis:
        title: Island
      field: island
      sort: -x
      type: nominal
  mark: bar
title:
  anchor: start
  fontSize: 20
  subtitle: Biscoe island has the highest penguin count, followed by Dream and Torgersen
  subtitleColor: '#666666'
  subtitleFontSize: 16
  text: Penguin Counts by Island
width: container
4. Renders the result:
All of this happens automatically when you just ask a question.
Your Work is Saved Automatically
Behind the scenes, Lumen organizes your work into Explorations — think of them as saved workspaces for each dataset or analysis thread.
When you ask your first question that queries data, Lumen creates an exploration to capture everything:
- Your conversation history
- The SQL queries generated
- Charts and visualizations
- Results and data tables
Follow-up questions stay together: Ask "Can you make that chart show only the top 5?" and your new chart appears in the same exploration.
New topics create new explorations: Ask about a different dataset or unrelated question, and Lumen starts a fresh exploration.
This means you can:
- Return to any analysis later
- Export your work as a Jupyter notebook
- Keep multiple investigations organized
- Build on previous results without losing context
Try with Your Own Data
Next Steps
- Navigating the UI - Learn the chat interface
- Using Lumen AI - Master natural language queries
- Examples - Step-by-step tutorials
- Configure LLM Providers - Customize your AI model