Branch a pipeline#
What does this guide solve?
This guide shows you how to build branching pipelines, allowing for views of the same source data at different steps in processing.
Overview#
See the Background page on Pipeline Branching.
Continue reading if you are working in YAML (most likely). If you are working in Python, jump to Branching in Python.
Branching in YAML#
As we will see, the essential component of branching in YAML is to use the pipeline: parameter.
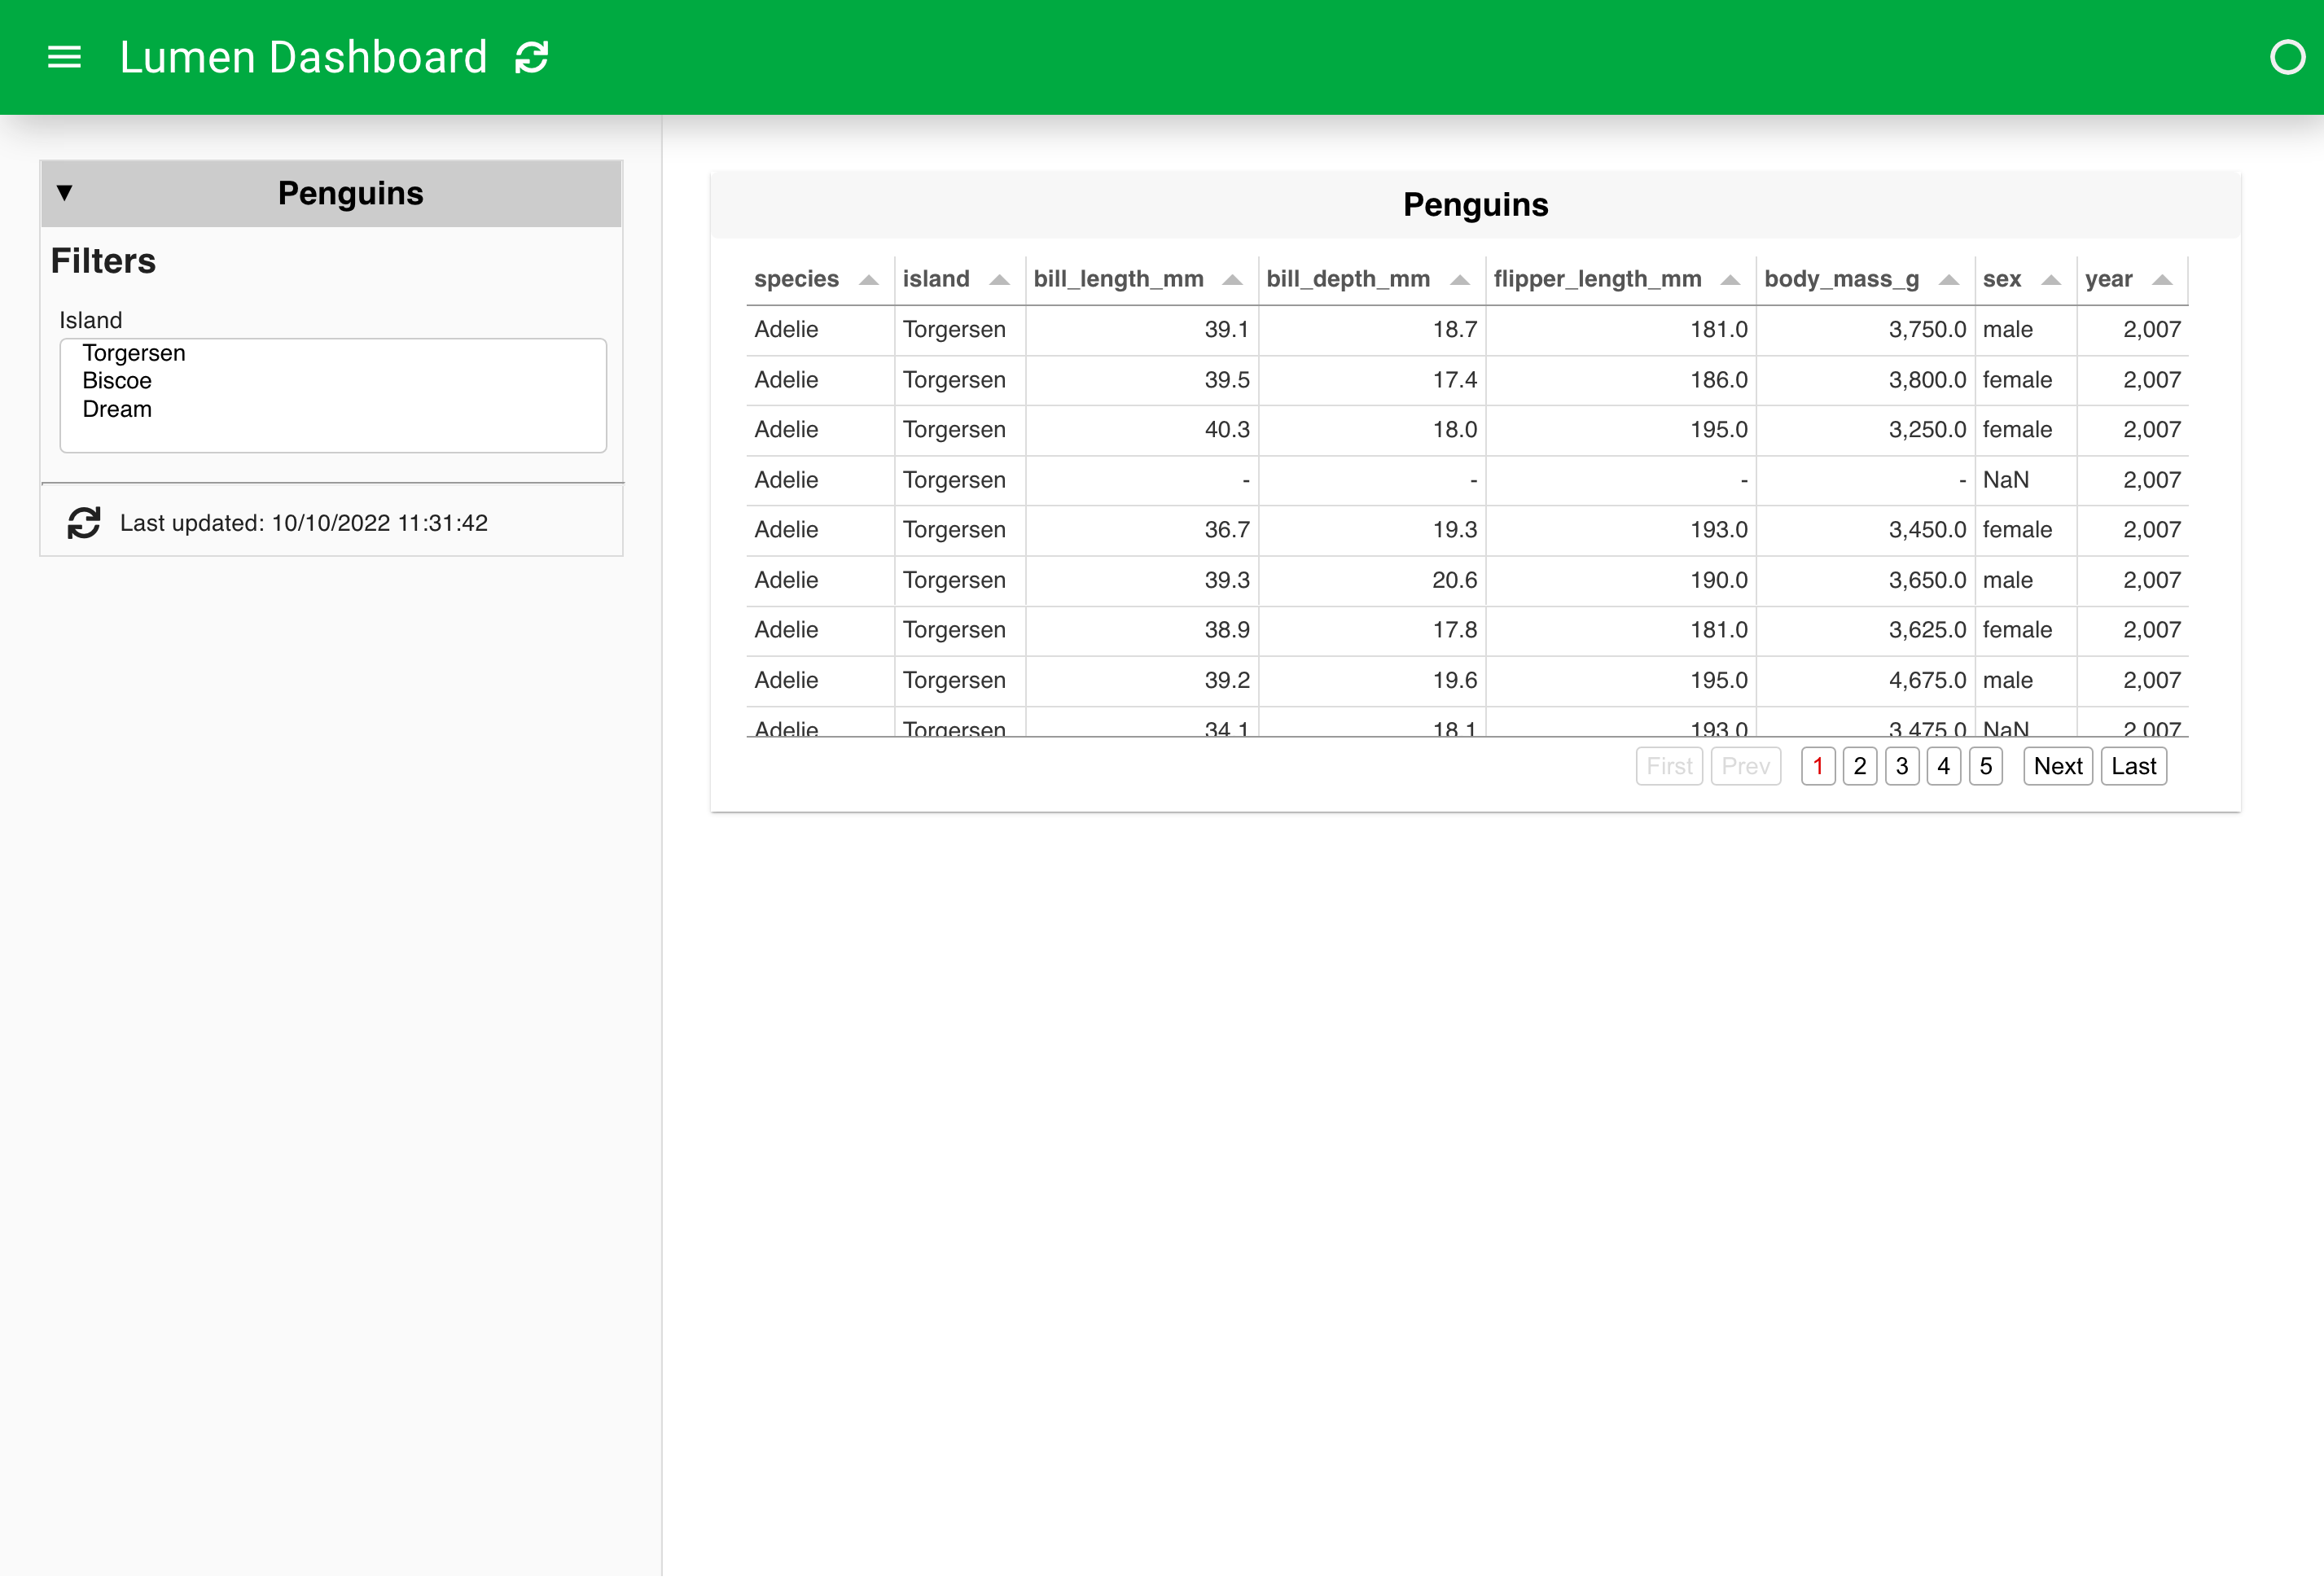
Initiating a simple dashboard#
Let’s first create a simple dashboard without a branch and launch to ensure that things are working properly.
sources:
  penguin_source:
    type: file
    tables:
      penguin_table: https://datasets.holoviz.org/penguins/v1/penguins.csv

pipelines:
  penguin_pipeline:
    source: penguin_source
    table: penguin_table
    filters:
      - type: widget
        field: island

layouts:
  - title: Penguins
    sizing_mode: stretch_width
    views:
      - type: table
        pipeline: penguin_pipeline
        show_index: false
        height: 300
lumen serve penguins.yaml --show --autoreload
Add a branch#
Now let’s add a new Pipeline that branches from the existing pipeline. We can accomplish this by adding a pipeline: parameter that refers back to the name of the first pipeline. In our example, our new pipeline, called branch_sort, has a pipeline: parameter that points back to penguin_pipeline.
sources:
  penguin_source:
    type: file
    tables:
      penguin_table: https://datasets.holoviz.org/penguins/v1/penguins.csv

pipelines:
  penguin_pipeline:
    source: penguin_source
    table: penguin_table
    filters:
      - type: widget
        field: island
  branch_sort:
    pipeline: penguin_pipeline
    transforms:
      - type: columns
        columns: ['species', 'island', 'bill_length_mm', 'bill_depth_mm']

layouts:
  - title: Penguins
    sizing_mode: stretch_width
    views:
      - type: table
        pipeline: penguin_pipeline
        show_index: false
        height: 300
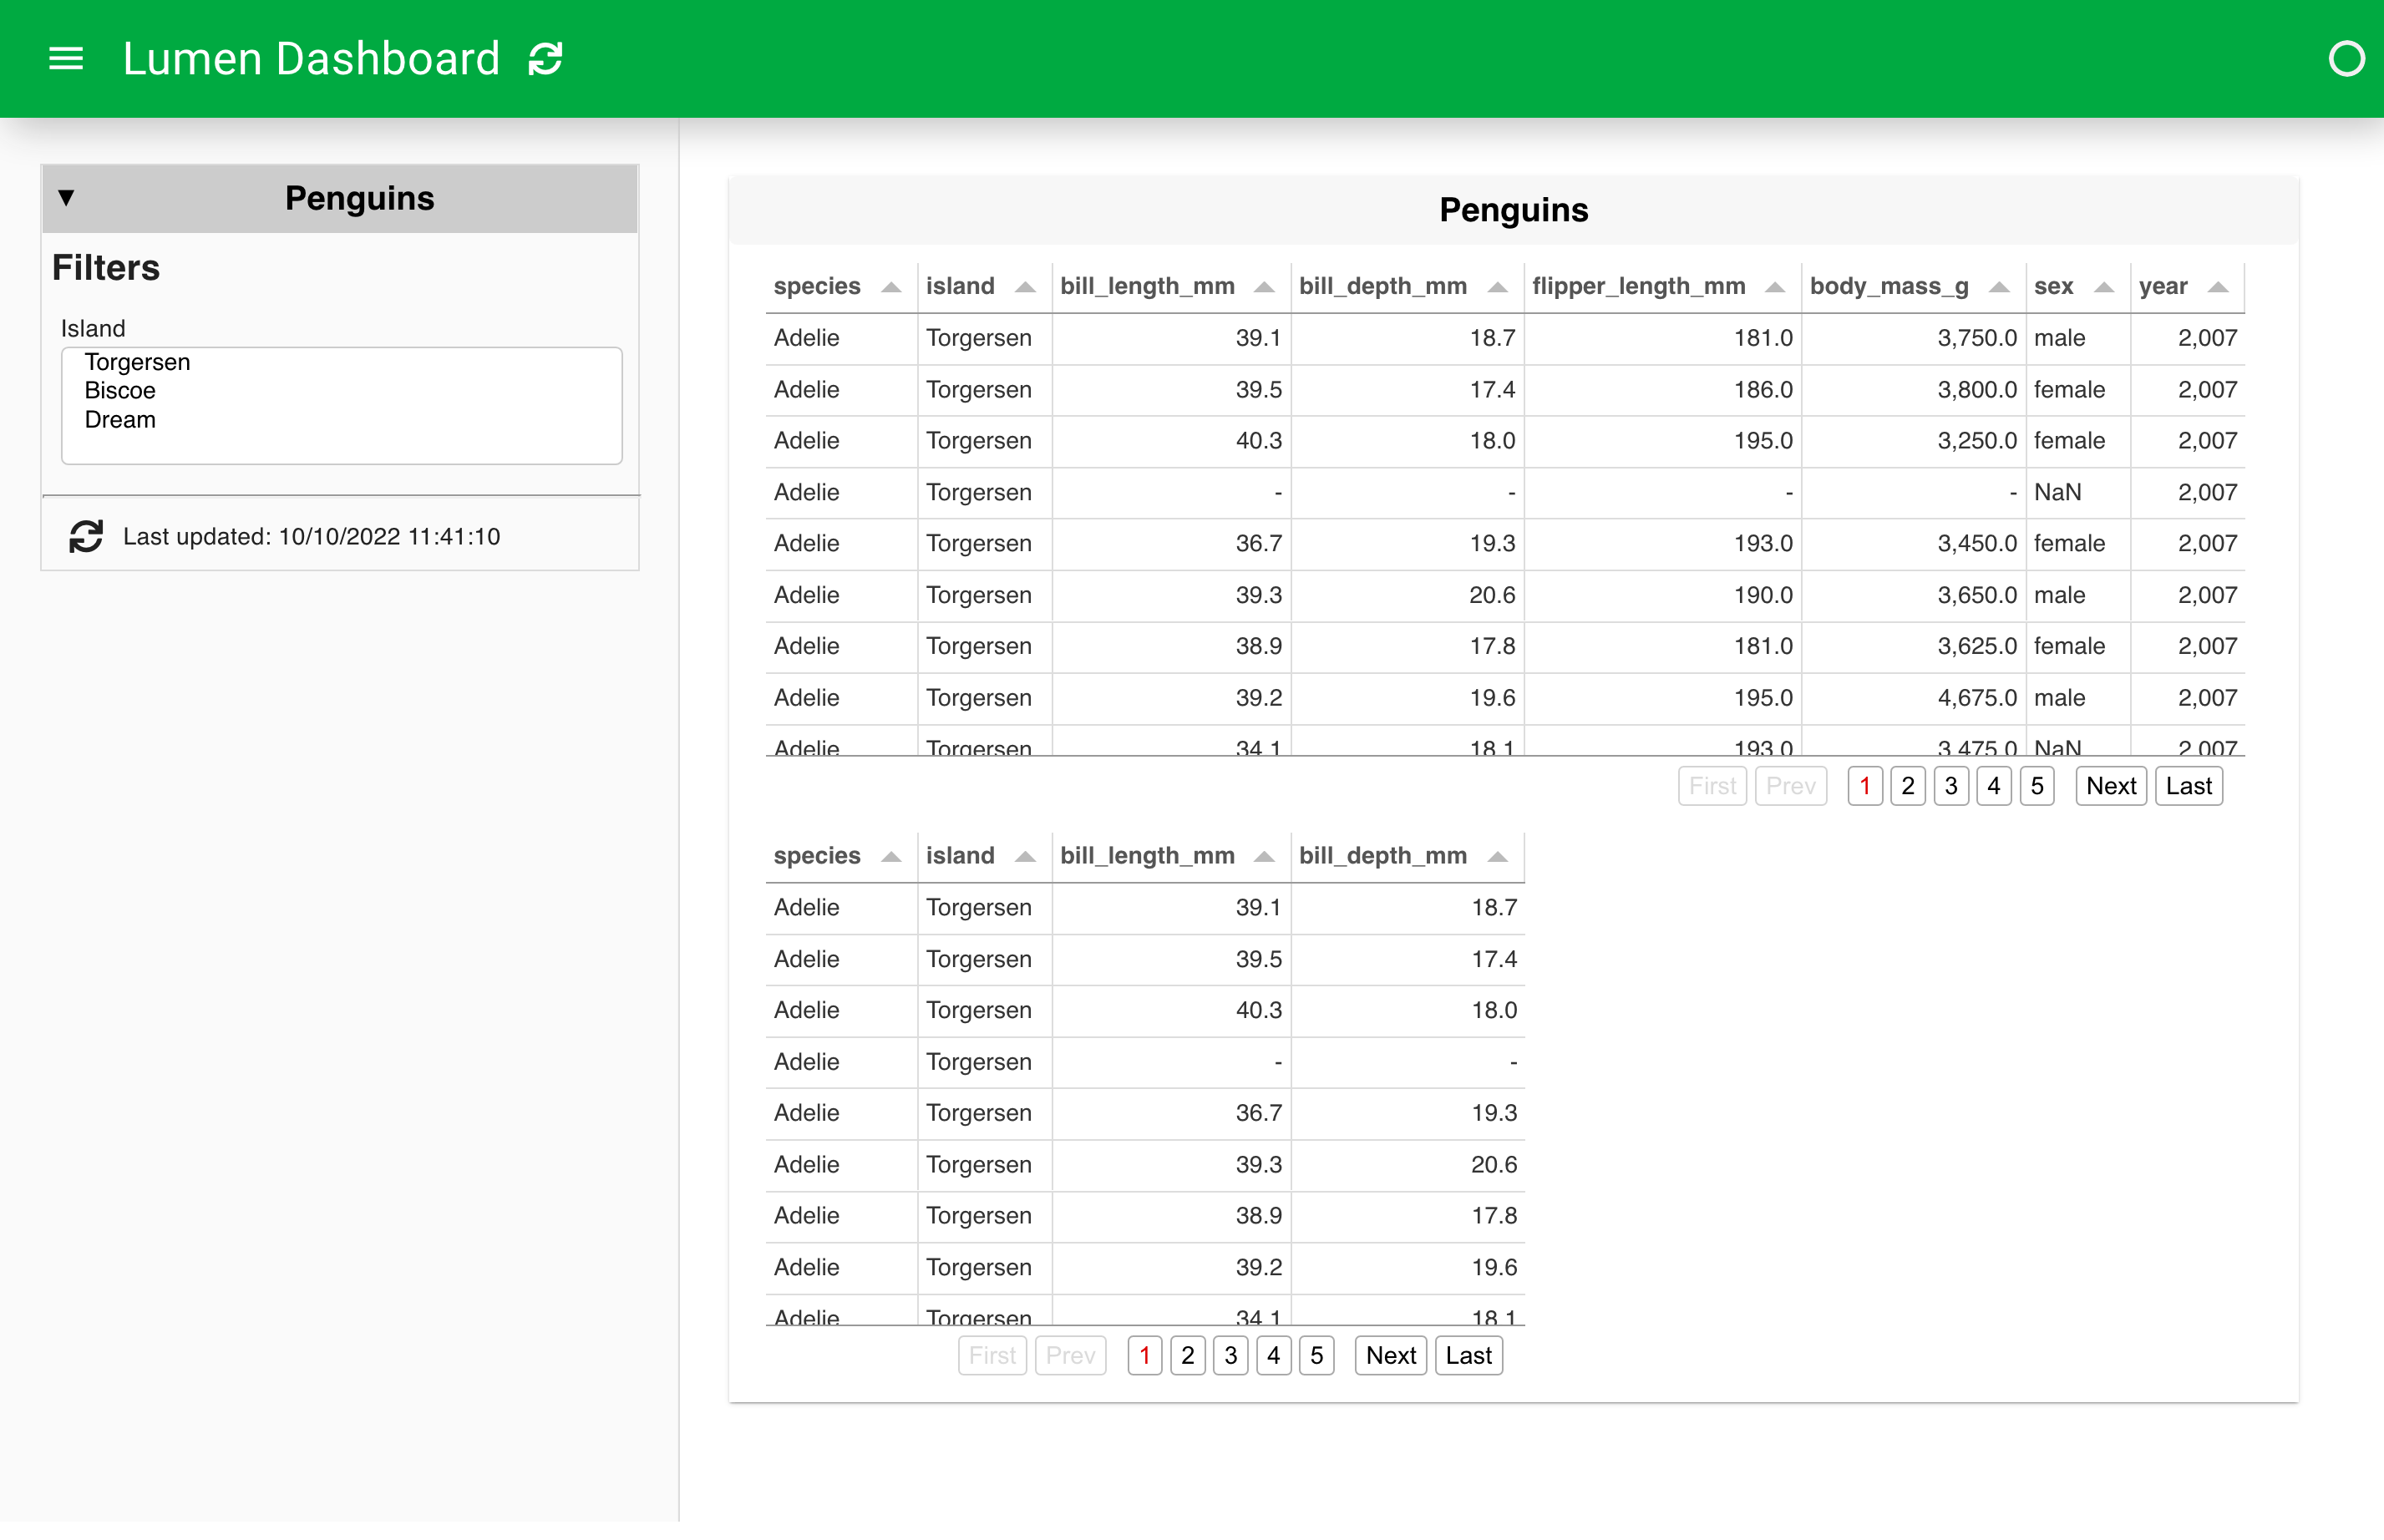
Refer to the branch in a new view#
Finally, we can create a new View that displays the additional data manipulation steps present on our branch. Below, we simply specify a new table view with a pipeline: parameter that refers to our new branch_sort.
sources:
  penguin_source:
    type: file
    tables:
      penguin_table: https://datasets.holoviz.org/penguins/v1/penguins.csv

pipelines:
  penguin_pipeline:
    source: penguin_source
    table: penguin_table
    filters:
      - type: widget
        field: island
  branch_sort:
    pipeline: penguin_pipeline
    transforms:
      - type: columns
        columns: ['species', 'island', 'bill_length_mm', 'bill_depth_mm']

layouts:
  - title: Penguins
    sizing_mode: stretch_width
    views:
      - type: table
        pipeline: penguin_pipeline
        show_index: false
        height: 300
      - type: table
        pipeline: branch_sort
        show_index: false
        height: 300
Branching in Python#
As we will see below, the primary tool to create a branch of a Pipeline in Python is to use the pipeline.chain method.
Initiating the pipeline#
Let’s start by creating a pipeline up to a branching point. See the How to guide - Build a dashboard in Python - for a walk-through of these initial steps.
from lumen.pipeline import Pipeline
from lumen.sources import FileSource

data_url = 'https://datasets.holoviz.org/penguins/v1/penguins.csv'

pipeline = Pipeline(source=FileSource(tables={'penguins': data_url}), table='penguins')

pipeline.add_filter('widget', field='species')
pipeline.add_filter('widget', field='island')
pipeline.add_filter('widget', field='sex')
pipeline.add_filter('widget', field='year')

pipeline.data
Branching the pipeline#
At this point, we will create a branch of our pipeline by using the pipeline.chain method, and apply a new transform that aggregates the data, only on this branch. We assign the result to a new Pipeline variable so that we can refer to it separately from the original pipeline.
from lumen.transforms import Aggregate

agg_pipeline = pipeline.chain(transforms=[Aggregate(method='mean', by=['species', 'year'])])

agg_pipeline.data