Build a dashboard#
What is the purpose of this page?
This tutorial is meant to get your hands dirty with building a Lumen dashboard. Don’t worry about understanding everything just yet - your only obligation is to complete the steps as directed.
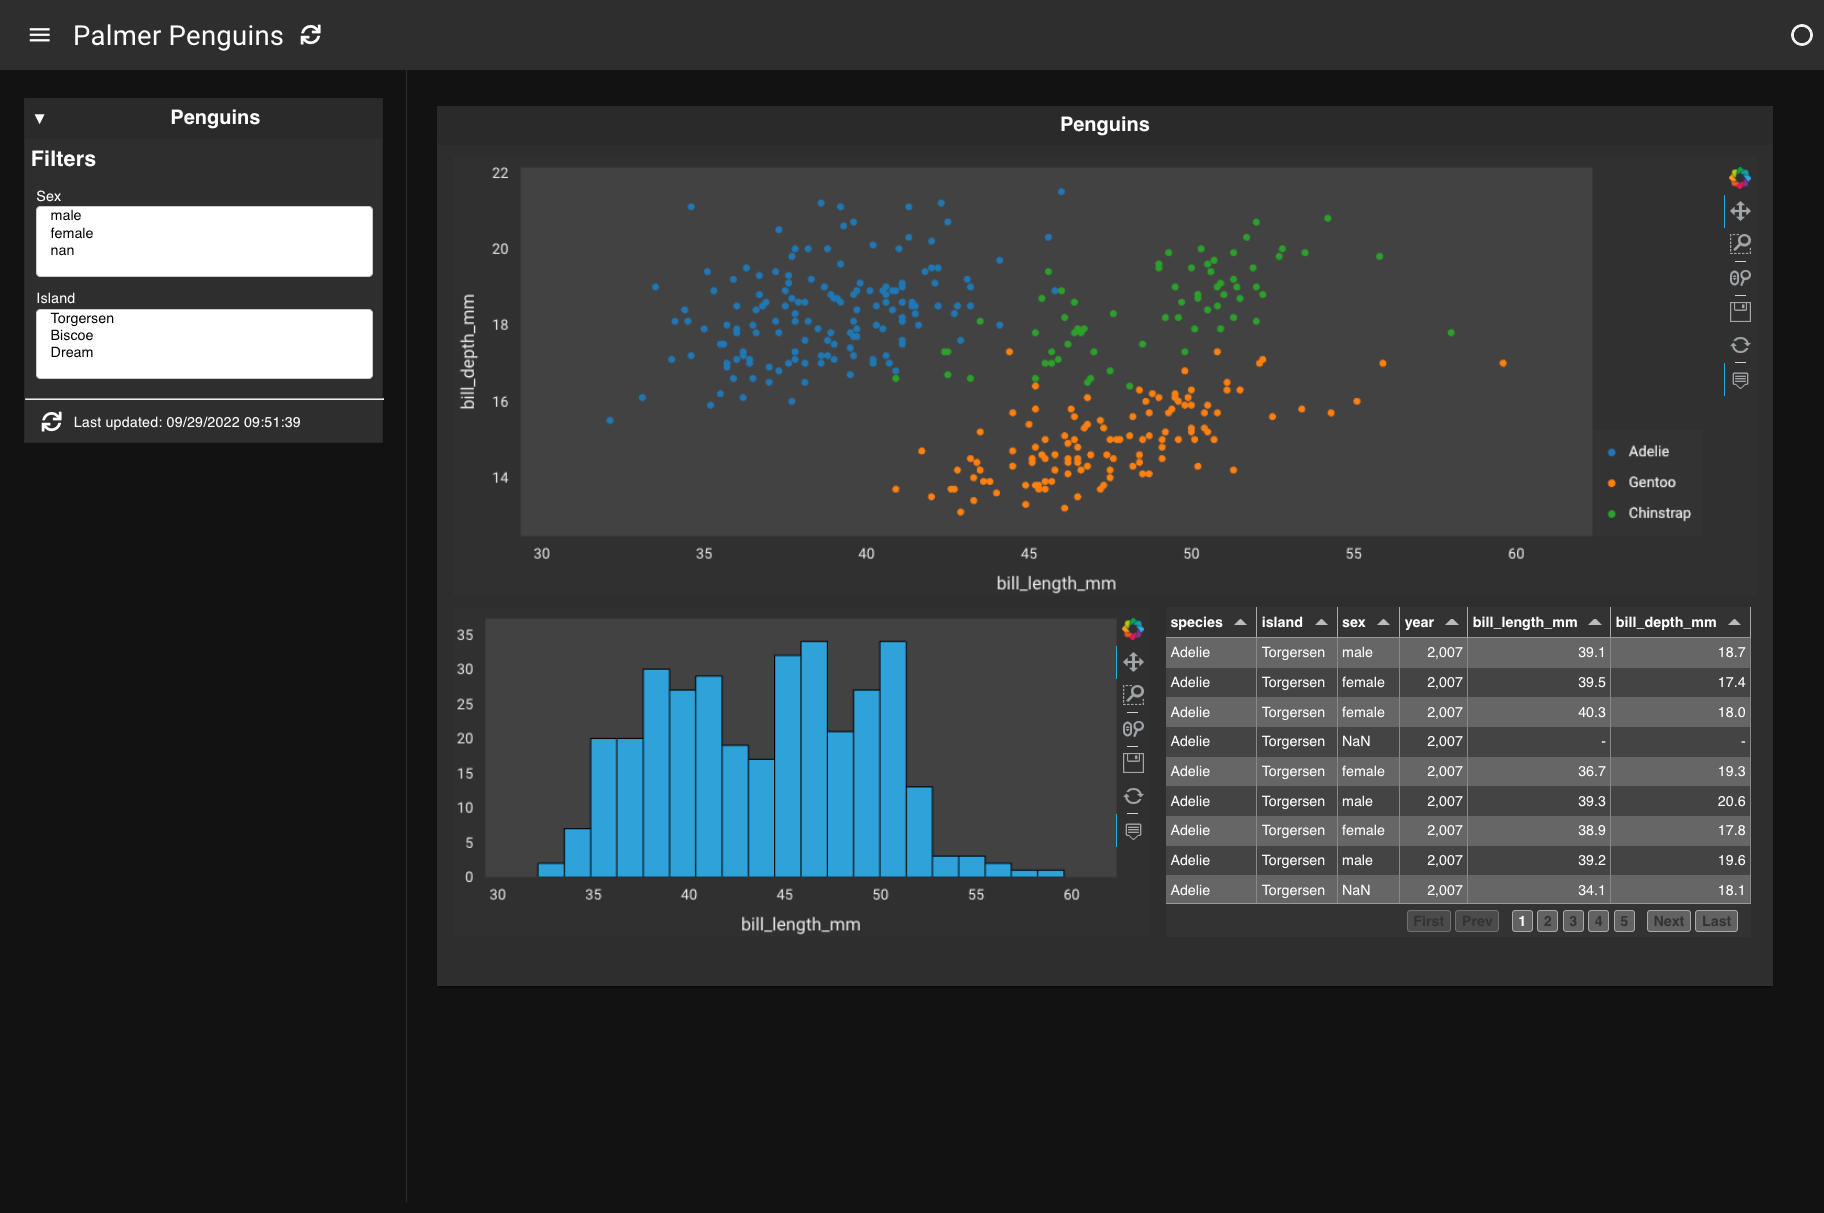
You will build a simple Lumen dashboard and deploy it in your browser. The result will look something like this:
1. Create a YAML file#
Open your favorite text editor and create an empty file called penguins.yaml.
2. Add a data source#
The first thing that is needed is a source of data. Insert and save the text below to add a remote FileSource. This will tell Lumen to fetch the Palmer Penguins dataset:
sources:
  penguin_source:
    type: file
    tables:
      penguin_table: https://datasets.holoviz.org/penguins/v1/penguins.csv
Once you have saved your file, open a terminal and navigate to the location of this file.
In the terminal, launch the file with:
lumen serve penguins.yaml --show --autoreload
By using --autoreload, the dashboard automatically updates the application whenever we make changes to the YAML file.
What you should see in your browser should now match what is on the Preview tab:
sources:
  penguin_source:
    type: file
    tables:
      penguin_table: https://datasets.holoviz.org/penguins/v1/penguins.csv
So far, this returns an empty dashboard because we haven’t yet specified a view - so let’s add one!
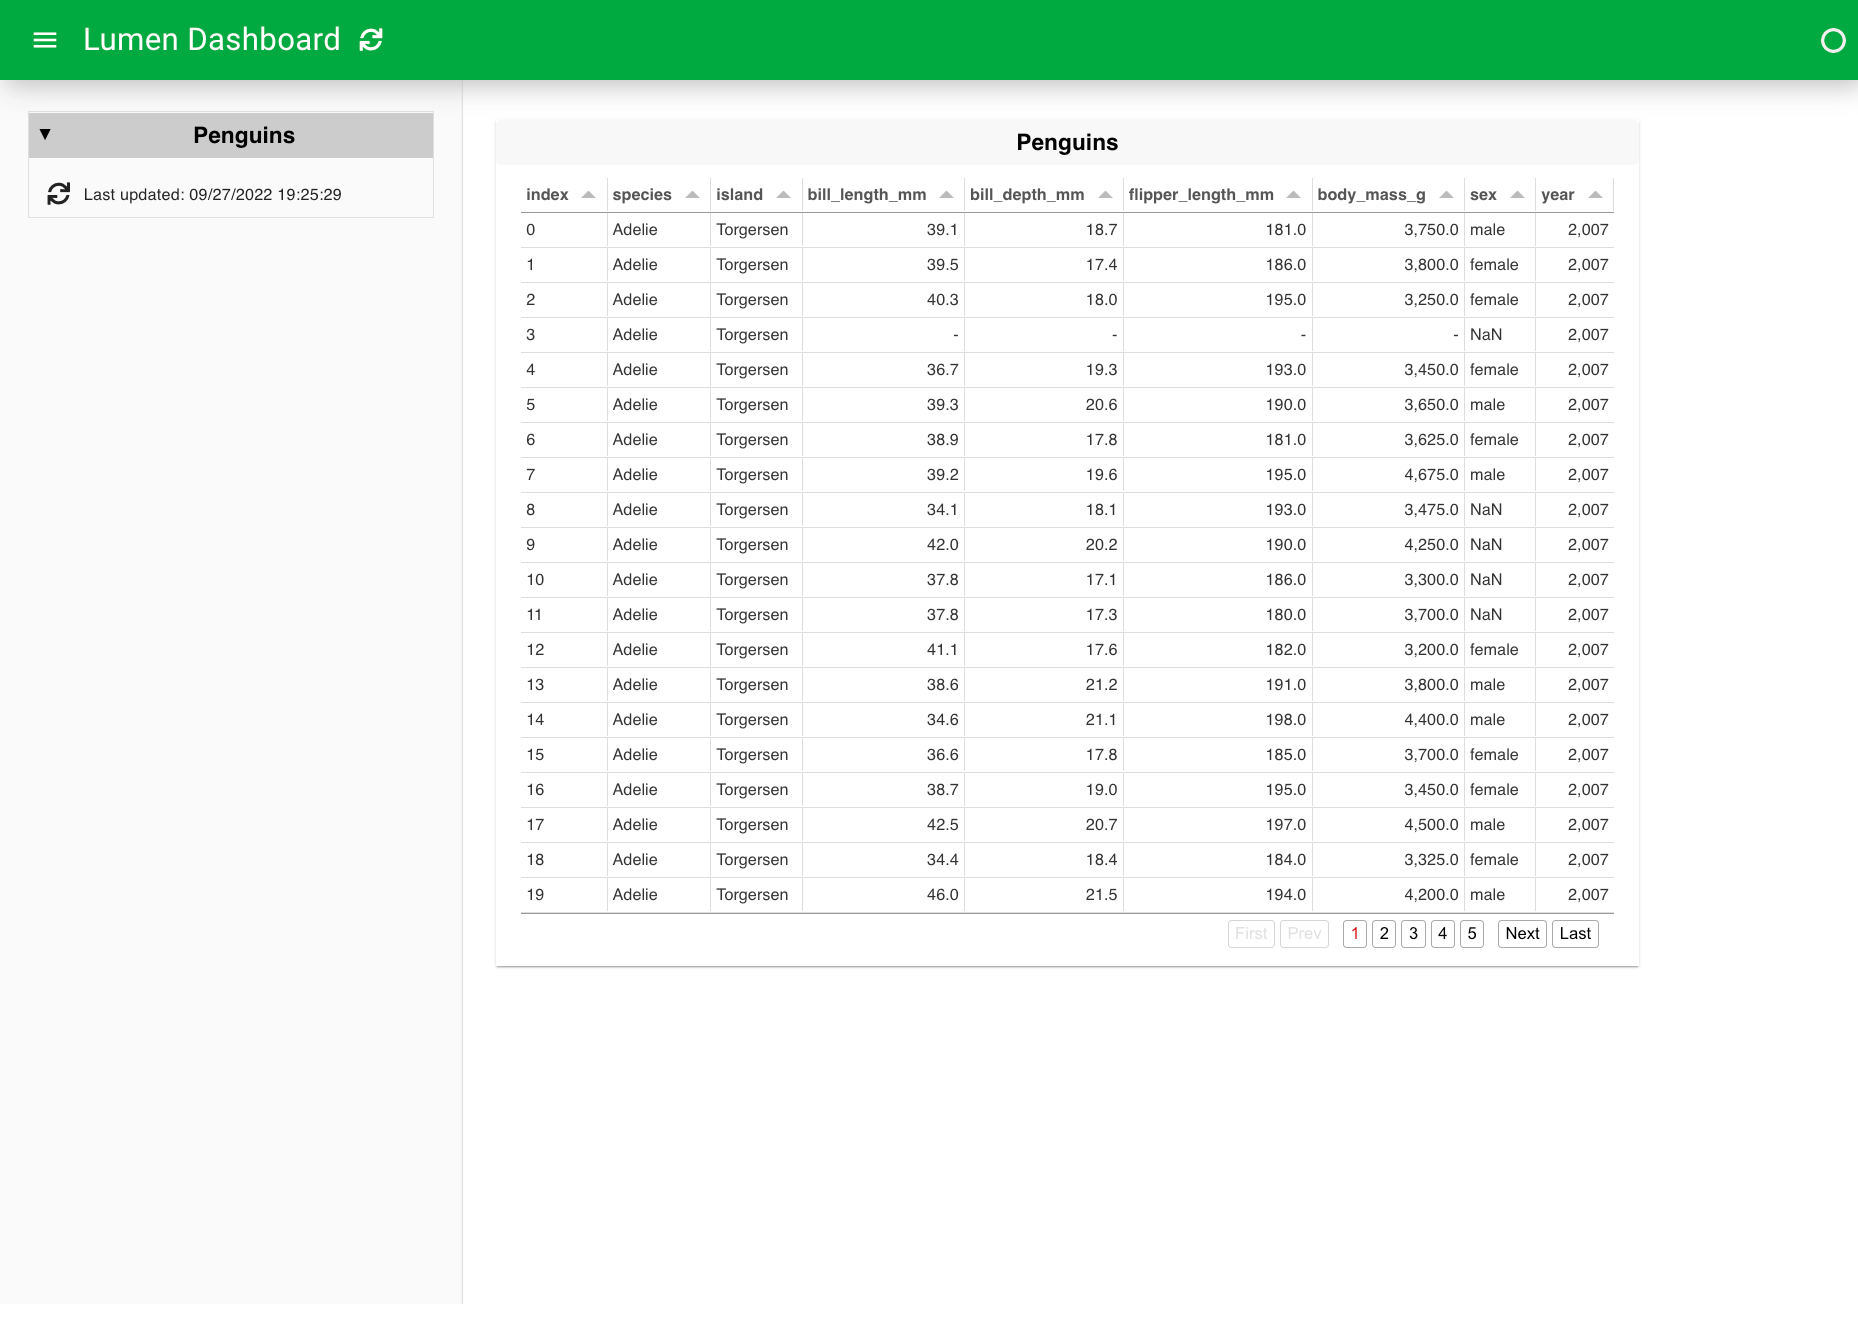
3. Specify a table view#
The simplest View to add is a table with the raw data. This gives us a good idea of what we are working with and the available fields.
sources:
  penguin_source:
    type: file
    tables:
      penguin_table: https://datasets.holoviz.org/penguins/v1/penguins.csv

layouts:
  - title: Penguins
    source: penguin_source
    views:
      - type: table
        table: penguin_table
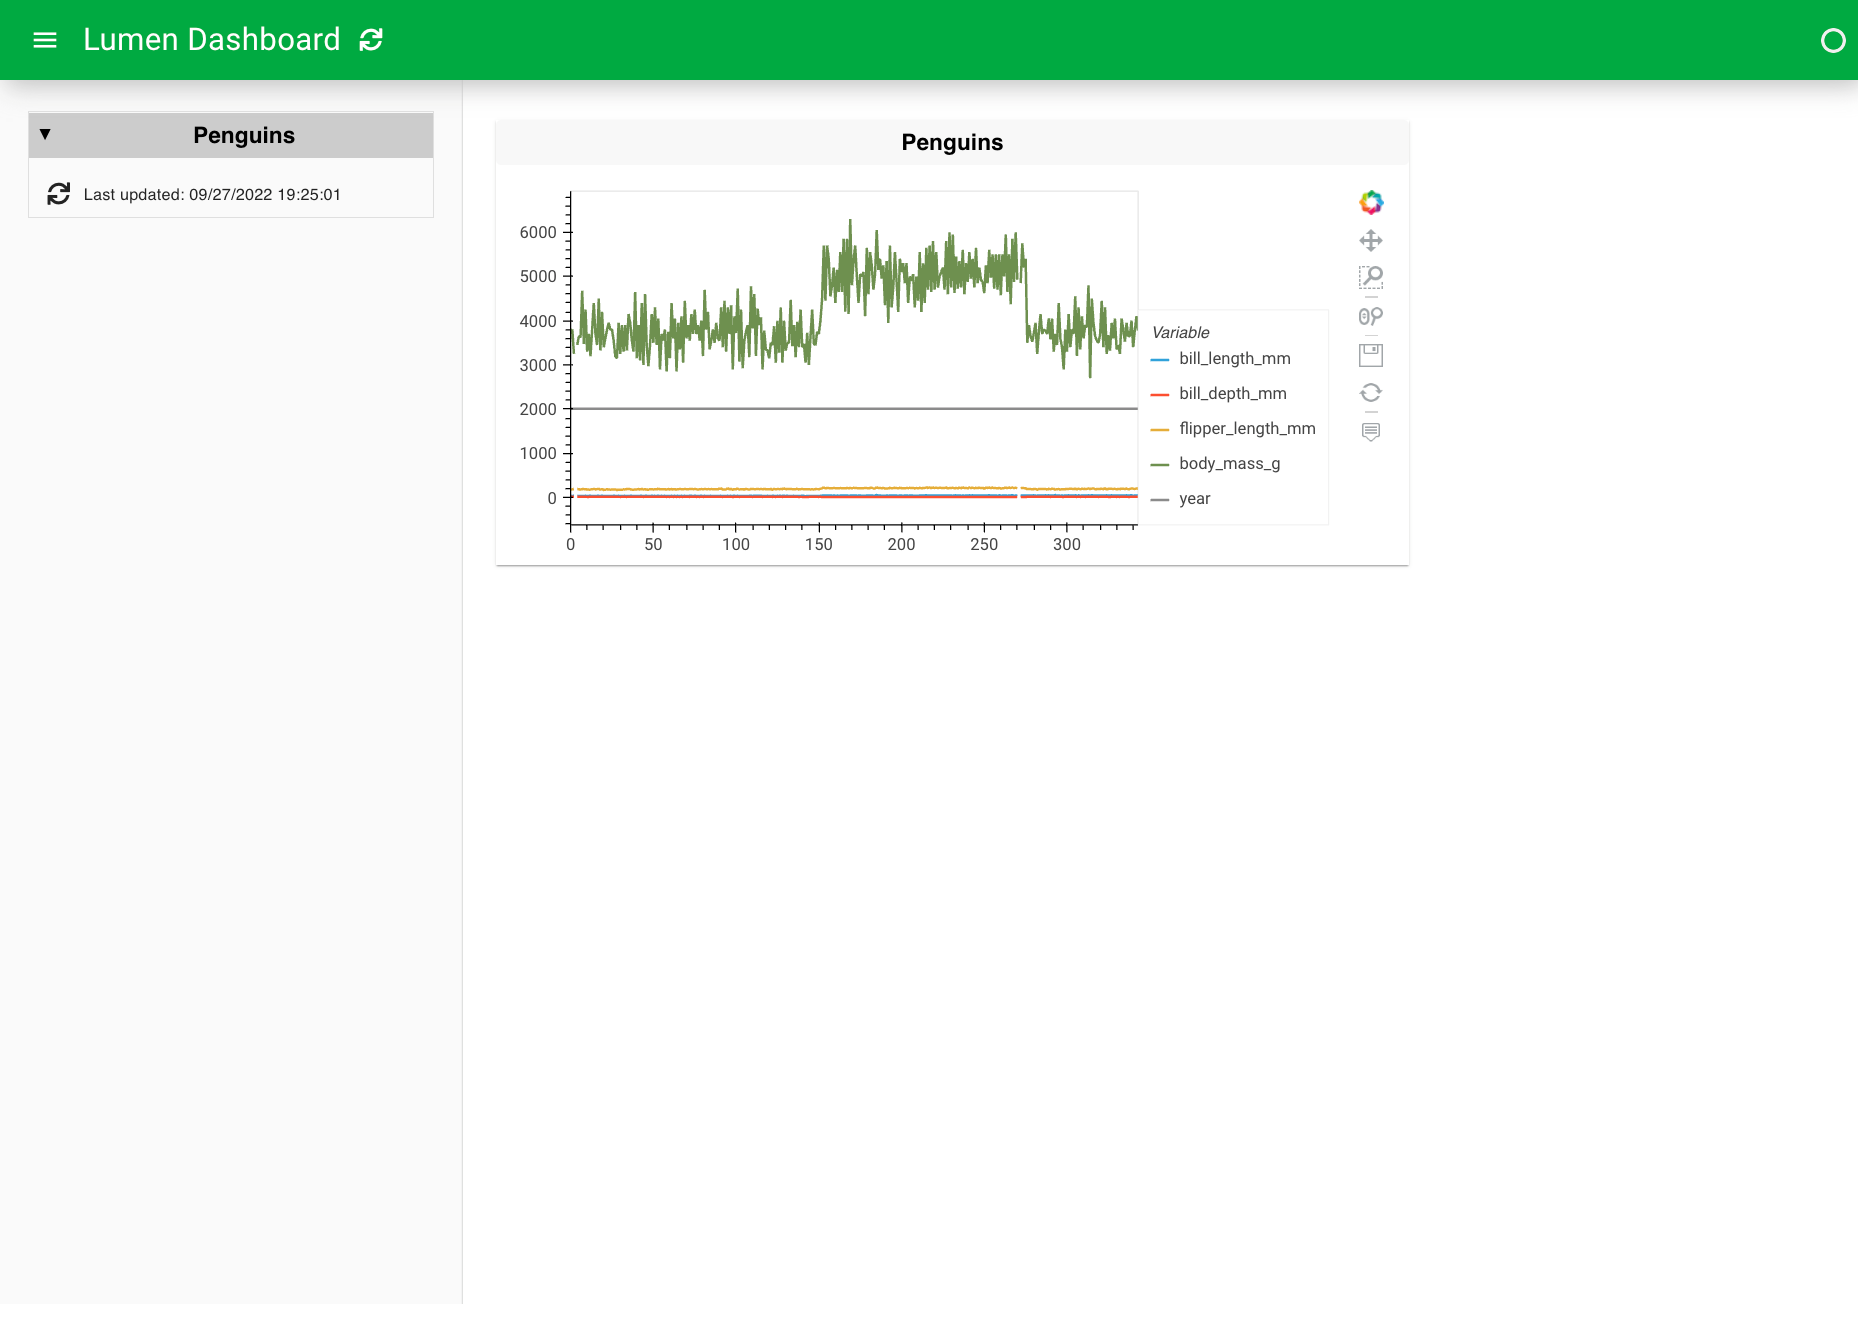
4. Create a plot view#
The table gives us a primer of the data source, but to start understanding patterns in the data, we have to visualize it. There is a wide range of views to chose from but for now we will create an hvPlotView (see hvPlot for background on the library). This is as easy as replacing the table type with a hvplot type.
sources:
  penguin_source:
    type: file
    tables:
      penguin_table: https://datasets.holoviz.org/penguins/v1/penguins.csv

layouts:
  - title: Penguins
    source: penguin_source
    views:
      - type: hvplot
        table: penguin_table
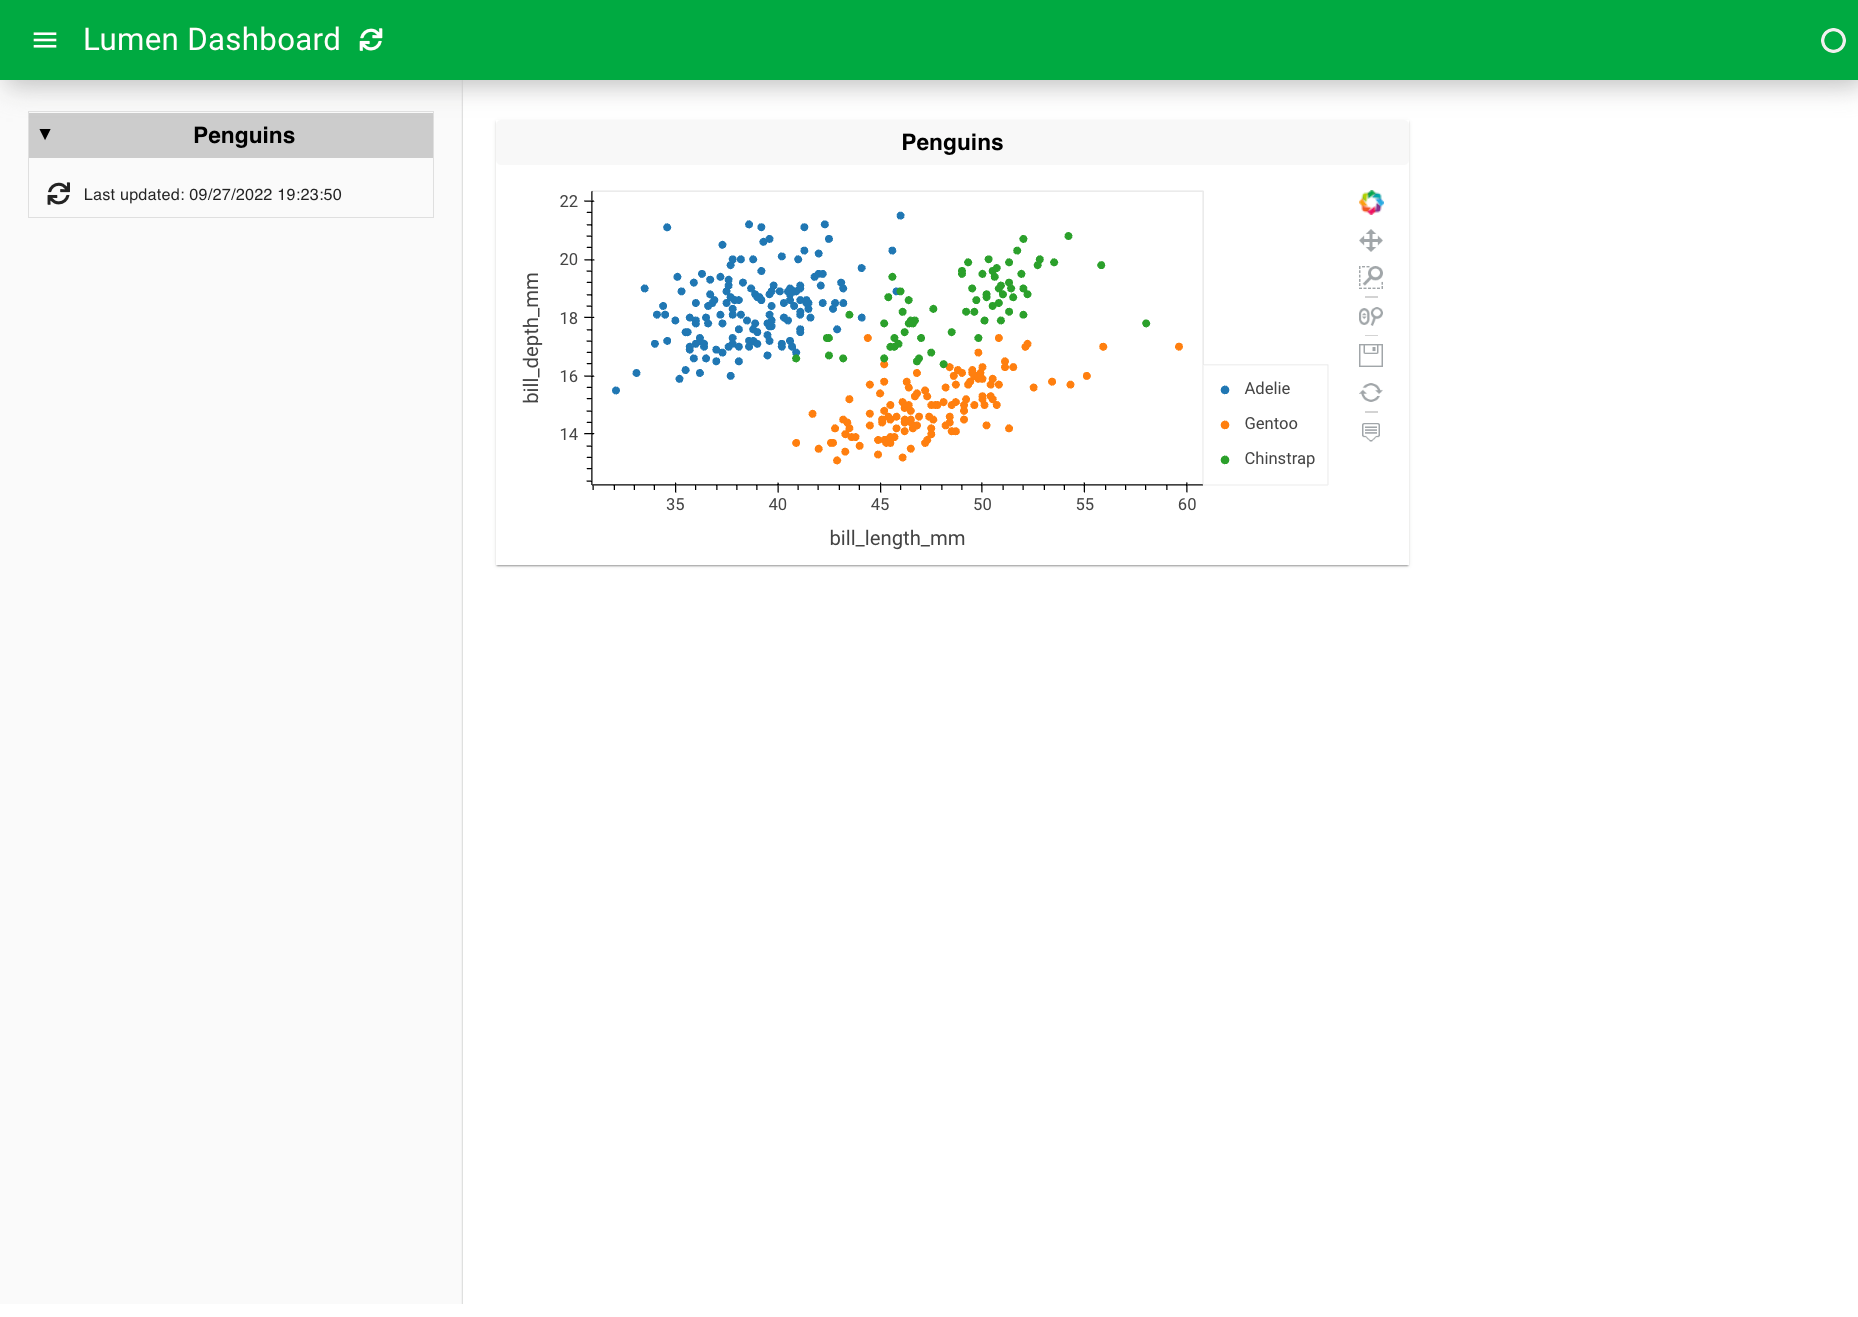
5. Make a scatter plot#
This plot is a bit overwhelming, so instead of plotting everything in one plot, we can plot bill_length_mm on the x-axis and bill_depth_mm on the y-axis. Furthermore, we can color based on the species and change the kind of the plot to scatter.
sources:
  penguin_source:
    type: file
    tables:
      penguin_table: https://datasets.holoviz.org/penguins/v1/penguins.csv
layouts:
  - title: Penguins
    source: penguin_source
    views:
      - type: hvplot
        table: penguin_table
        kind: scatter
        x: bill_length_mm
        y: bill_depth_mm
        color: species
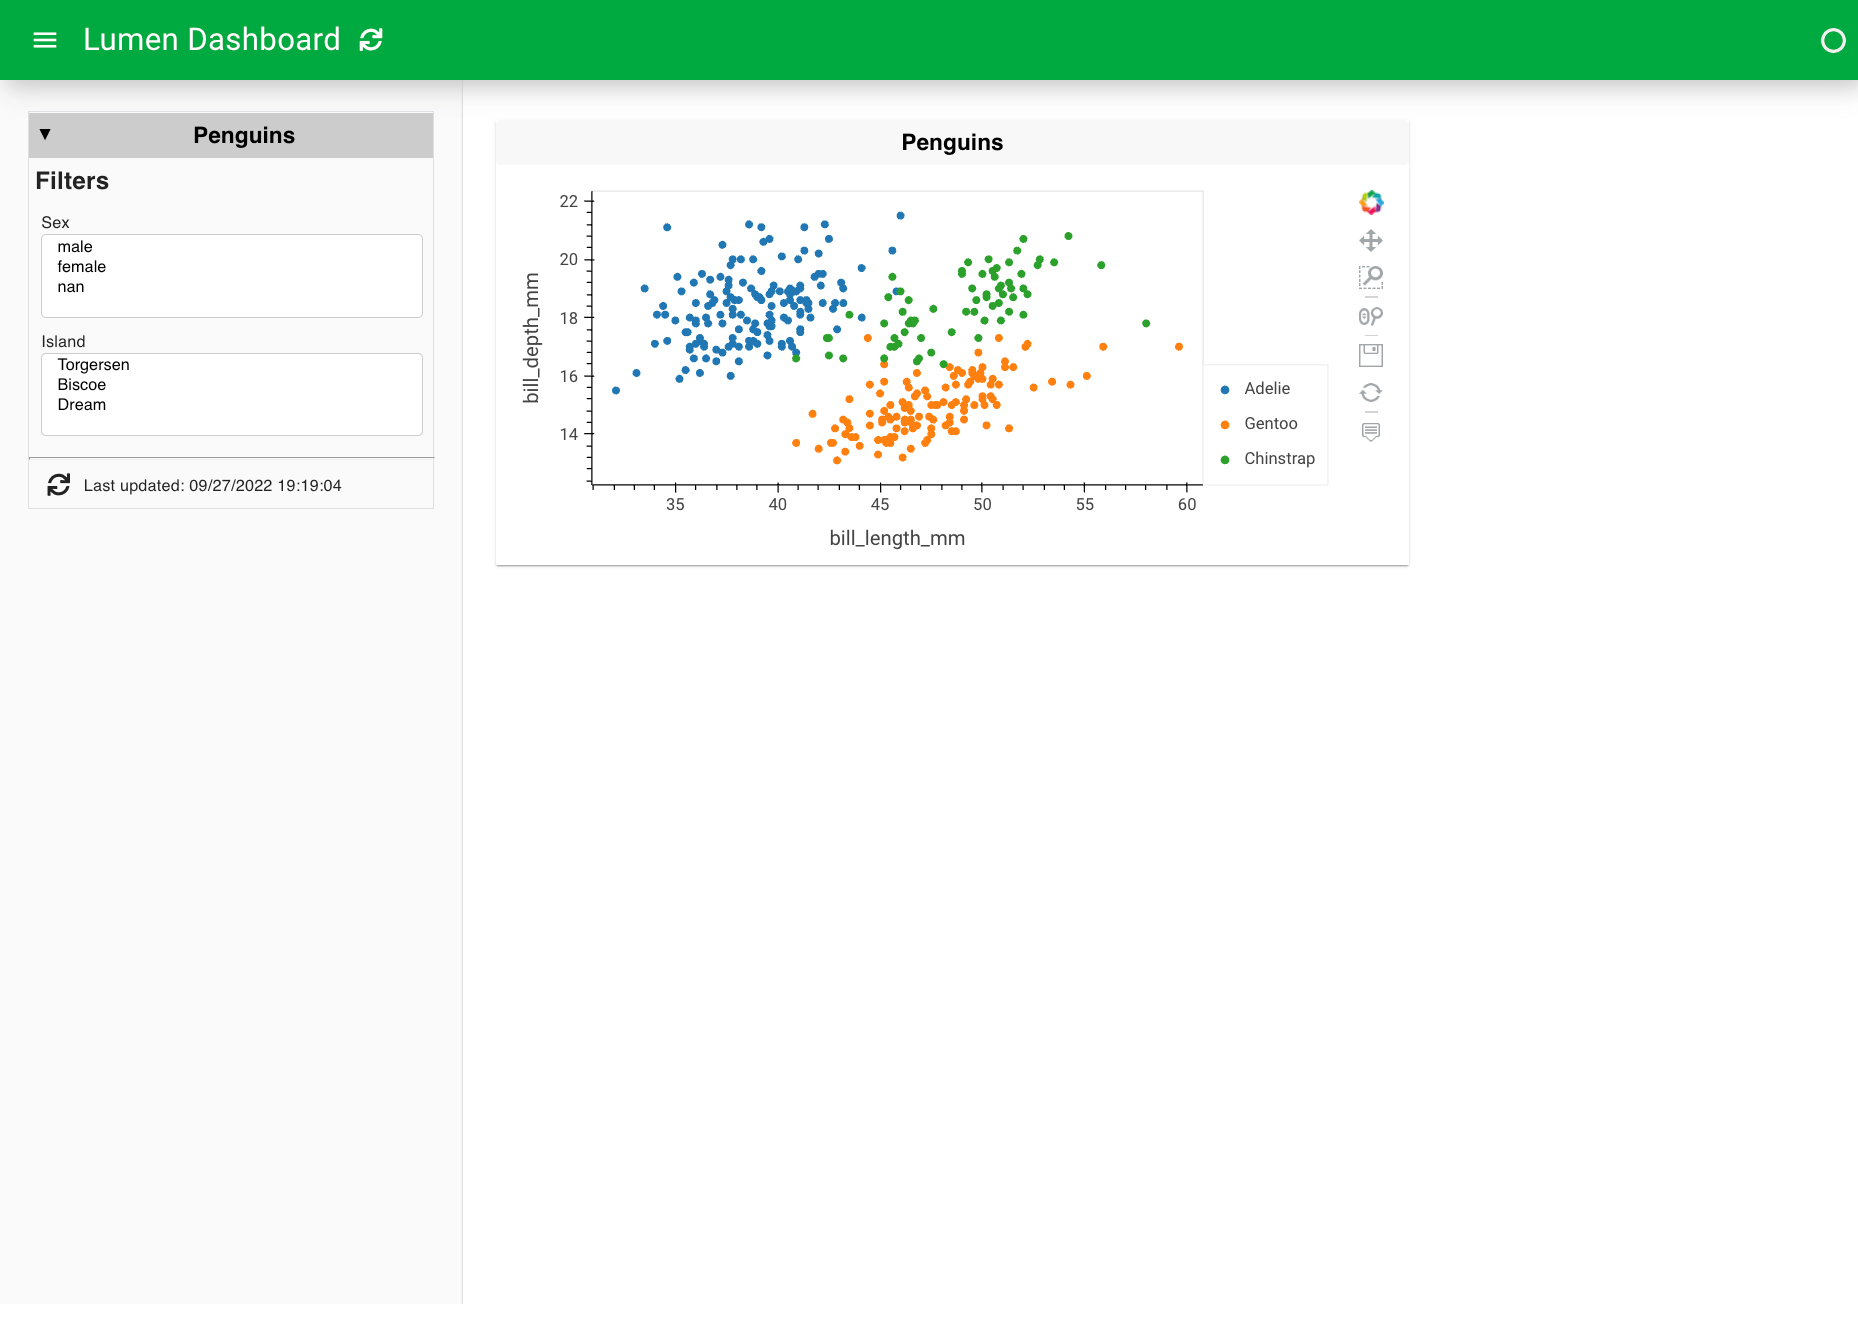
6. Manipulate the data#
Let’s now set up two filter widgets based on two fields of the data - ‘sex’ and ‘island’. Since we don’t need all of the data columns, let’s also add a transform to select only a subset of the data.
sources:
  penguin_source:
    type: file
    tables:
      penguin_table: https://datasets.holoviz.org/penguins/v1/penguins.csv

pipelines:
  penguin_pipeline:
    source: penguin_source
    table: penguin_table
    filters:
      - type: widget
        field: sex
      - type: widget
        field: island
    transforms:
      - type: columns
        columns: ['species', 'island', 'sex', 'year', 'bill_length_mm', 'bill_depth_mm']

layouts:
  - title: Penguins
    pipeline: penguin_pipeline
    views:
      - type: hvplot
        x: bill_length_mm
        y: bill_depth_mm
        kind: scatter
        color: species
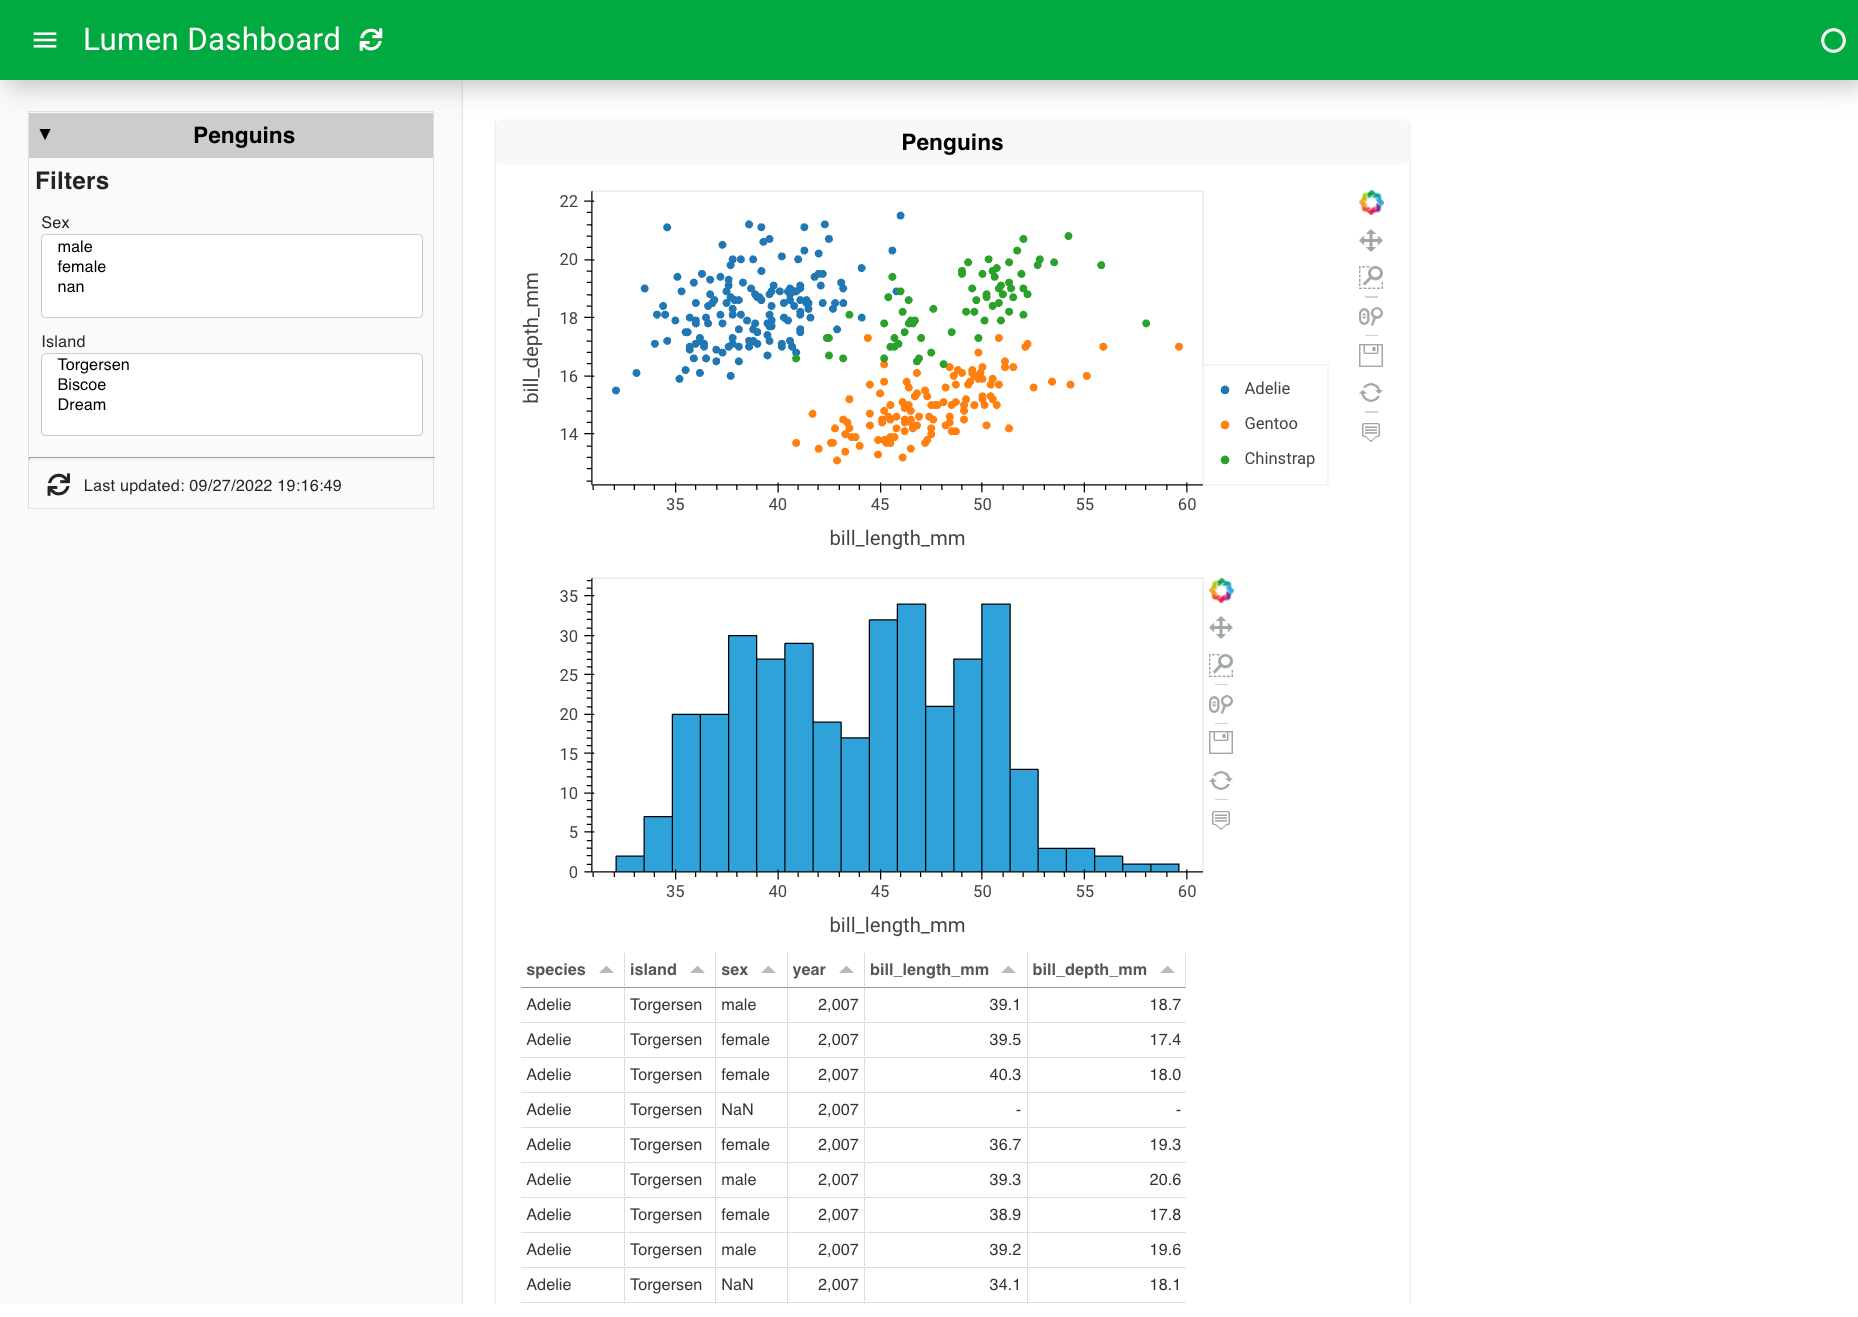
7. Expand the view types#
We can even expand the views with a histogram and a table.
sources:
  penguin_source:
    type: file
    tables:
      penguin_table: https://datasets.holoviz.org/penguins/v1/penguins.csv

pipelines:
  penguin_pipeline:
    source: penguin_source
    table: penguin_table
    filters:
      - type: widget
        field: sex
      - type: widget
        field: island
    transforms:
      - type: columns
        columns: ['species', 'island', 'sex', 'year', 'bill_length_mm', 'bill_depth_mm']

layouts:
  - title: Penguins
    pipeline: penguin_pipeline
    views:
      - type: hvplot
        x: bill_length_mm
        y: bill_depth_mm
        kind: scatter
        color: species
      - type: hvplot
        kind: hist
        y: bill_length_mm
      - type: table
        show_index: false
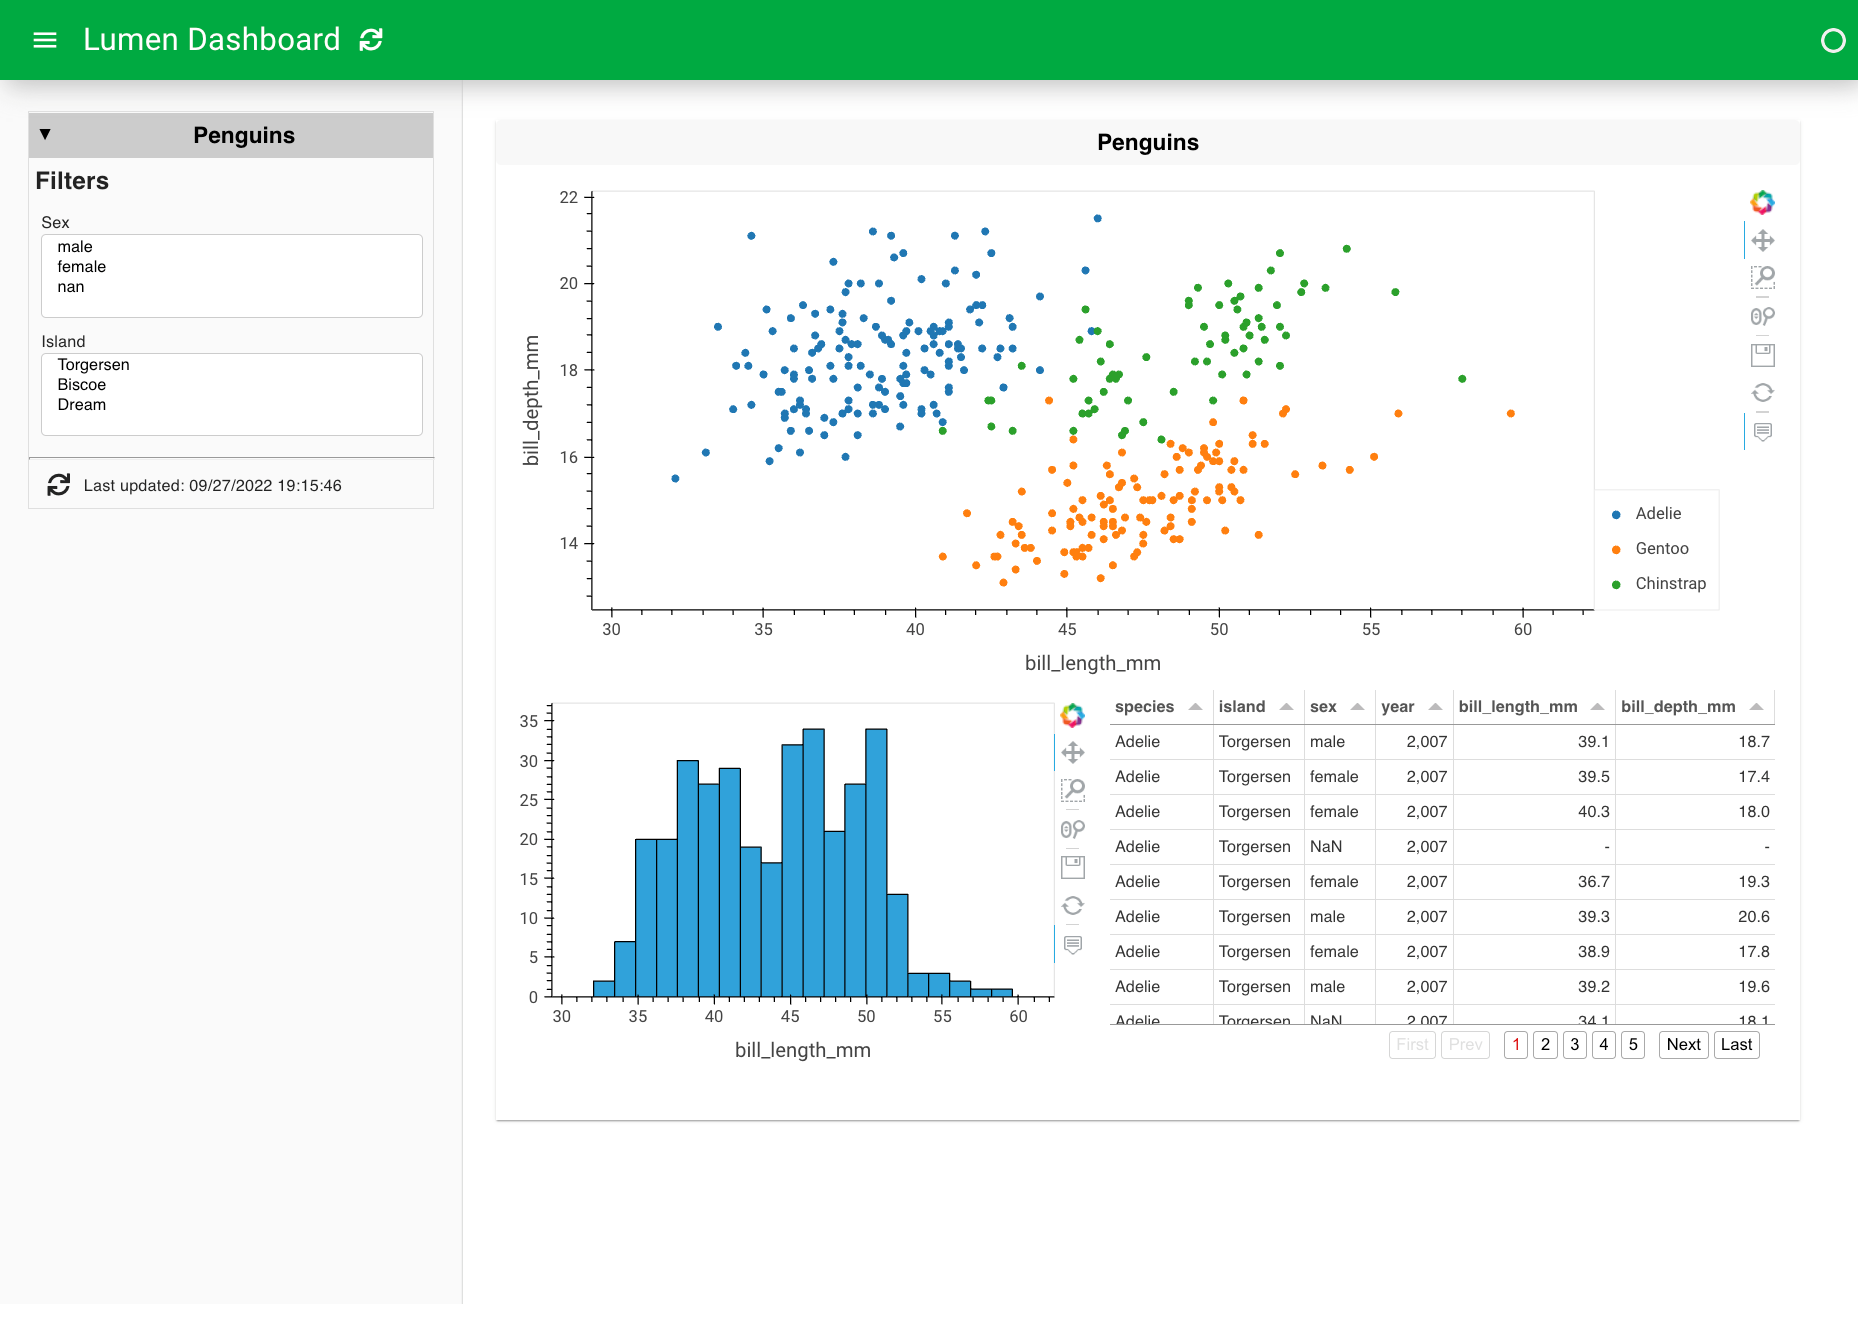
8. Customize the appearance and behavior#
The default layout we get is less than ideal for this case since it cuts off one of our plots, leaves a lot of empty space, and does not resize responsively. We can get responsive plots by adding sizing_mode to the layout and responsive to the views. By changing the layout and height, we can further customize how the dashboard looks.
sources:
  penguin_source:
    type: file
    tables:
      penguin_table: https://datasets.holoviz.org/penguins/v1/penguins.csv

pipelines:
  penguin_pipeline:
    source: penguin_source
    table: penguin_table
    filters:
      - type: widget
        field: sex
      - type: widget
        field: island
    transforms:
      - type: columns
        columns: ['species', 'island', 'sex', 'year', 'bill_length_mm', 'bill_depth_mm']

layouts:
  - title: Penguins
    pipeline: penguin_pipeline
    layout: [[0], [1, 2]]
    sizing_mode: stretch_width
    height: 800
    views:
      - type: hvplot
        x: bill_length_mm
        y: bill_depth_mm
        kind: scatter
        color: species
        responsive: true
        height: 400
      - type: hvplot
        kind: hist
        y: bill_length_mm
        responsive: true
        height: 300
      - type: table
        show_index: false
        height: 300
9. Add a title and theme#
Final step - let’s use a config section to give our dashboard a more descriptive title and change the overall theme to dark. Note that we can also set our table to dark by adding a new theme parameter at the bottom.
config:
  title: Palmer Penguins
  theme: dark

sources:
  penguin_source:
    type: file
    tables:
      penguin_table: https://datasets.holoviz.org/penguins/v1/penguins.csv

pipelines:
  penguin_pipeline:
    source: penguin_source
    table: penguin_table
    filters:
      - type: widget
        field: sex
      - type: widget
        field: island
    transforms:
      - type: columns
        columns: ['species', 'island', 'sex', 'year', 'bill_length_mm', 'bill_depth_mm']

layouts:
  - title: Penguins
    pipeline: penguin_pipeline
    layout: [[0], [1, 2]]
    sizing_mode: stretch_width
    height: 800
    views:
      - type: hvplot
        x: bill_length_mm
        y: bill_depth_mm
        kind: scatter
        color: species
        responsive: true
        height: 400
      - type: hvplot
        kind: hist
        y: bill_length_mm
        responsive: true
        height: 300
      - type: table
        show_index: false
        height: 300
        theme: midnight
Congratulations! You have created your first Lumen dashboard and know a bit more about penguins!
Note
This is just a simple example of how to build a dashboard with Lumen. The next step is to review the core concepts of what we just achieved so you can generalize these steps to create your own dashboard.