Building a data pipeline#
import lumen
import panel as pn

pn.extension('tabulator')
Lumen dashboards are a powerful, declarative way to write data-driven applications and dashboards. However Lumen components also provide a powerful abstraction that can be leveraged independently of a full dashboard YAML specification. Specifically the Pipeline component offers an extremely powerful basis for building data transformations that can either be used to power analysis pipelines or to drive visual components we can render in a notebook or a custom Panel dashboard. In this section we will discover how to leverage pipelines in this way.
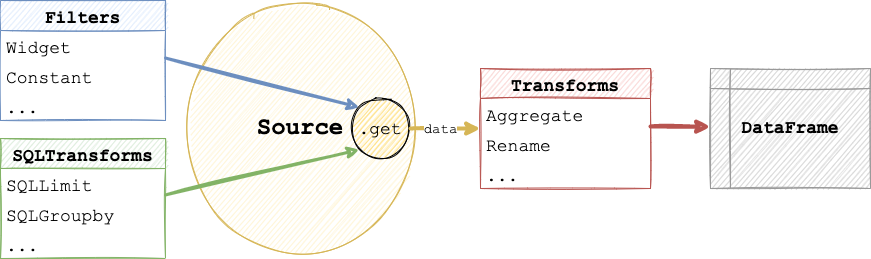
First however we need to understand how Pipelines work, specifically the order in which operations are applied. In particular we need to distinguish between operations that are applied by the Source and operations that are applied to data returned by the Source. This is because various Source types support data queries and in the case of SQL based Source may also support arbitrary SQL transforms. This means that the Pipeline will first call the Source.get method with state of the Filter and SQLTransform components allowing the Source to optimize the filter queries and transforms and return the data, once the data is returned as a DataFrame the declared Transform stages will be applied in sequence.
Declaring a pipeline#
Just like any other component in Lumen Pipeline components can be built using a declarative specification. Let us for example build a Pipeline that starts with a FileSource and applies a number of filters and transforms.
from lumen.pipeline import Pipeline

data_url = 'https://datasets.holoviz.org/penguins/v1/penguins.csv'

pipeline = Pipeline.from_spec({
    'source': {
        'type': 'file',
        'tables': {
            'penguins': data_url
        }
    },
    'filters': [
        {'type': 'widget', 'field': 'species'},
        {'type': 'widget', 'field': 'island'},
        {'type': 'widget', 'field': 'sex'},
        {'type': 'widget', 'field': 'year'}
    ],
    'transforms': [
        {'type': 'aggregate', 'method': 'mean', 'by': ['species', 'sex', 'year']}
    ]
})
Once declared we can inspect the current data easily:
pipeline.data
Note that a Pipeline updates dynamically if any Source, Filter or Transform is changed or updated. In the pipeline above we declared ‘widget’ filters which we can render by accessing the control_panel property. To view the dynamically updating data can instantiate a lumen.views.Table component. In a live notebook we will now get an interactive application letting us dynamically filter the data and view the result.
from lumen.views import Table

pn.Row(pipeline.control_panel, Table(pipeline=pipeline, pagination='remote'))
Note that since a Pipeline is a Parameterized object we can pass the data parameter to a Panel component e.g. here we bind the data to a DataFrame pane:
pn.Row(
    pipeline.control_panel,
    pn.pane.DataFrame(pipeline.param.data, width=800)
)
Programmatically building pipelines#
A Pipeline does not have to be built using the declarative specification, instead we can programmatically build the same pipeline:
from lumen.sources import FileSource

source = FileSource(tables={'penguins': data_url})
pipeline = Pipeline(source=source, table='penguins')

pipeline.add_filter('widget', field='species')
pipeline.add_filter('widget', field='island')
pipeline.add_filter('widget', field='sex')
pipeline.add_filter('widget', field='year')

pipeline
Automatic filters#
By setting filters='auto' we can also have Lumen automatically generate filters for all available columns:
Pipeline(source=source, table='penguins', filters='auto')
Chaining pipelines#
In some cases you will want to build branching pipelines, e.g. in an initial stage you filter the data and display it and in another stage you aggregate your data.
from lumen.transforms import Aggregate

agg_pipeline = pipeline.chain(transforms=[Aggregate(method='mean', by=['species', 'year'])])

agg_pipeline.data
By chaining the Pipeline we can share computations between different stages, i.e. the filtering step still occurs in the first stage.
Building a dashboard#
One of the major benefits of the Pipeline architecture is that it allows Lumen components to be used outside of the context of a Lumen application. This makes it possible to build custom dashboards while still leveraging the power of all Lumen components. Let us compose a simple dashboard application driven by the pipeline we defined above.
from lumen.views import hvPlotUIView

pn.Row(
    pipeline.control_panel.servable(area='sidebar'),
    pn.Tabs(
        ('Plot', hvPlotUIView(pipeline=pipeline, kind='scatter', x='bill_length_mm', y='bill_depth_mm', by='species')),
        ('Table', Table(pipeline=agg_pipeline))
    ).servable()
)