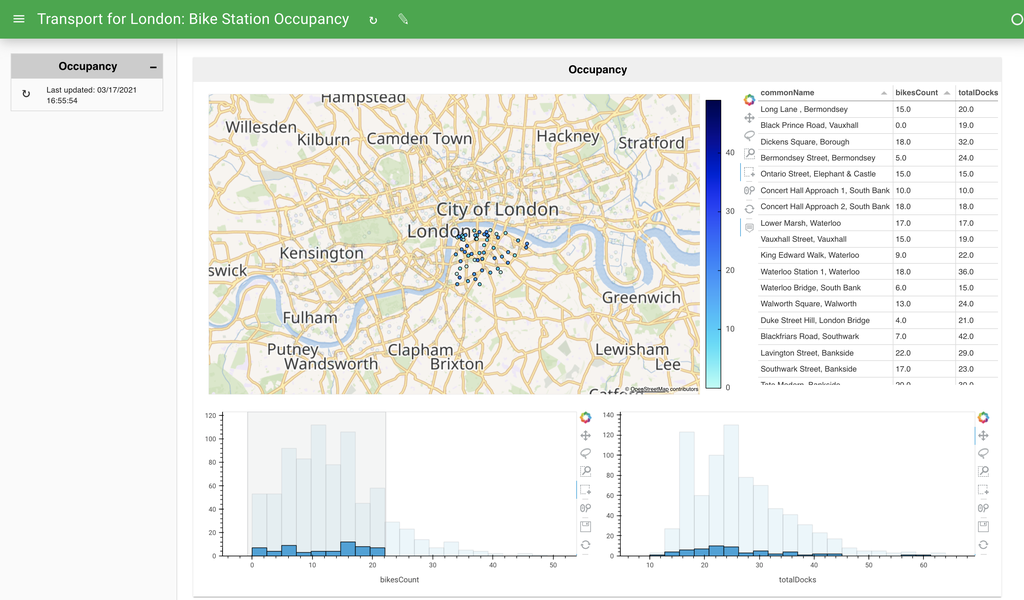
config:
  title: "Transport for London: Bike Station Occupancy"
  layout: column
variables:
  TFL_API_KEY:
    type: constant
    value: a1c692de000b4944af55f59d8e849915
sources:
  stations:
    type: json
    shared: true
    tables:
      stations: "https://api.tfl.gov.uk/BikePoint/"
  occupancy:
    type: json
    chunk_size: 15
    cache_dir: cache
    tables:
      occupancy: "https://api.tfl.gov.uk/Occupancy/BikePoints/${stations.stations.id}?app_key=${variables.TFL_API_KEY}"
  station_occupancy:
    type: join
    sources: [stations, occupancy]
    tables:
      station_occupancy:
        - source: stations
          table: stations
          index: id
        - source: occupancy
          table: occupancy
          index: id
pipelines:
  station_occupancy:
    source: station_occupancy
    table: station_occupancy
    filters:
      - type: widget
        field: bikesCount
      - type: widget
        field: totalDocks
      - type: constant
        field: lat
        value: [50, 52]
      - type: constant
        field: lon
        value: [-1, 1]
    transforms:
      - type: columns
        columns: [commonName, bikesCount, totalDocks, lat, lon]
      - type: project_lnglat
        latitude: lat
        longitude: lon
  selected:
    pipeline: station_occupancy
    filters:
      - type: param
        parameter: locations.selection_expr
layouts:
  - title: "Occupancy"
    layout: [[locations, table], [count_hist, total_hist]]
    views:
      locations:
        type: hvplot
        pipeline: station_occupancy
        kind: points
        x: lon
        y: lat
        hover_cols: [commonName]
        tiles: EsriStreet
        responsive: true
        height: 500
        color: bikesCount
        line_color: black
        xaxis: null
        yaxis: null
        framewise: false
        selection_group: bikes
      table:
        type: table
        pipeline: selected
        height: 500
        margin: [0, 100]
        hidden_columns: [lat, lon]
        show_index: false
        sizing_mode: stretch_width
      count_hist:
        type: hvplot
        pipeline: station_occupancy
        kind: hist
        y: bikesCount
        responsive: true
        height: 300
        streaming: true
        selection_group: bikes
      total_hist:
        type: hvplot
        pipeline: station_occupancy
        kind: hist
        y: totalDocks
        responsive: true
        height: 300
        streaming: true
        selection_group: bikes

