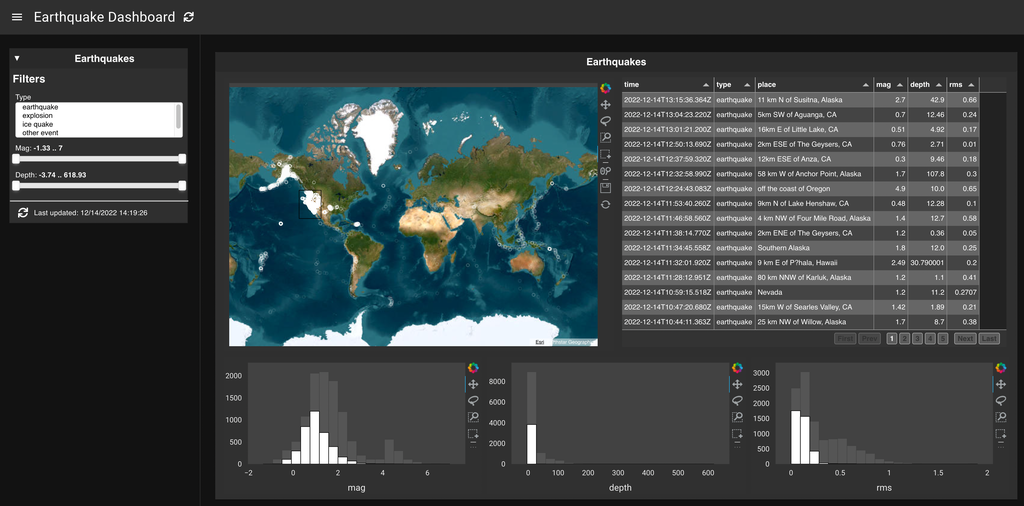
config:
  title: Earthquake Dashboard
  theme: dark
sources:
  earthquakes:
    type: file
    cache_per_query: false
    tables:
      earthquakes: ["https://earthquake.usgs.gov/fdsnws/event/1/query?format=csv", "csv"]
pipelines:
  earthquakes:
    source: earthquakes
    table: earthquakes
    filters:
      - type: widget
        field: type
      - type: widget
        field: mag
      - type: widget
        field: depth
    transforms:
      - type: columns
        columns:
          - time
          - longitude
          - latitude
          - type
          - place
          - mag
          - depth
          - rms
      - type: project_lnglat
        longitude: longitude
        latitude: latitude
  selected:
    pipeline: earthquakes
    filters:
      - type: param
        parameter: map.selection_expr
layouts:
  - title: Earthquakes
    views:
      map:
        type: hvplot
        pipeline: earthquakes
        kind: points
        x: longitude
        y: latitude
        tiles: ESRI
        responsive: true
        height: 500
        fill_color: null
        line_color: white
        xaxis: null
        yaxis: null
        selection_group: earthquakes
        streaming: true
        hover: false
      table:
        type: table
        pipeline: selected
        hidden_columns:
          - longitude
          - latitude
        page_size: 16
        pagination: remote
        sizing_mode: stretch_width
        show_index: false
        theme: midnight
      mag_hist:
        type: hvplot
        pipeline: earthquakes
        kind: hist
        y: mag
        fill_color: white
        responsive: true
        height: 250
        selection_group: earthquakes
        streaming: true
      depth_hist:
        type: hvplot
        pipeline: earthquakes
        kind: hist
        y: depth
        fill_color: white
        responsive: true
        height: 250
        selection_group: earthquakes
        streaming: true
      rms_hist:
        type: hvplot
        pipeline: earthquakes
        kind: hist
        y: rms
        fill_color: white
        responsive: true
        height: 250
        selection_group: earthquakes
        streaming: true
    refresh_rate: 60000
    layout: [[0, 1], [2, 3, 4]]

