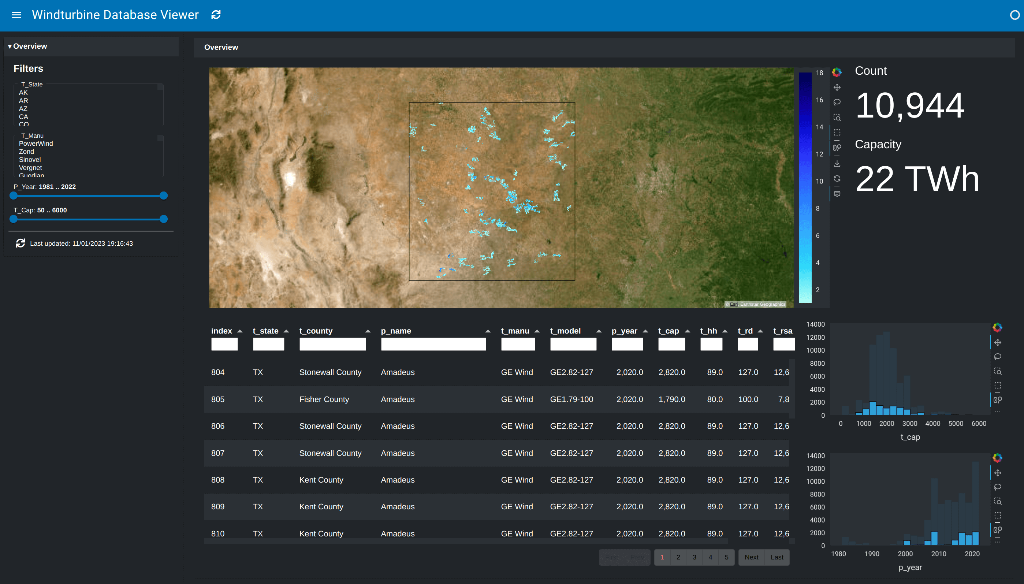
config:
  title: Windturbine Database Viewer
  theme: dark
  template: material
sources:
  windturbines:
    type: duckdb
    cache_dir: ./cache
    uri: ":memory:"
    tables:
      windturbines: "read_parquet('s3://datasets.holoviz.org/windturbines/v1/windturbines.parq')"
    initializers:
      - "INSTALL httpfs;"
      - "LOAD httpfs;"
variables:
  state:
    type: url
  color_by:
    type: widget
    kind: panel.widgets.Select
    options:
      - t_manu
      - t_year
    value: t_manu
pipelines:
  continental:
    source: windturbines
    filters:
      - type: constant
        field: xlong
        value: [-125, -66]
      - type: constant
        field: ylat
        value: [24, 50]
      - type: constant
        field: t_state
        value: $variables.state
  windturbines:
    pipeline: continental
    filters:
      - type: widget
        field: t_state
      - type: widget
        field: t_manu
      - type: widget
        field: p_year
      - type: widget
        field: t_cap
  filtered:
    pipeline: windturbines
    filters:
      - type: param
        parameter: points.selection_expr
  table:
    pipeline: filtered
    transforms:
      - type: columns
        columns: [t_state, t_county, p_name, t_manu, t_model, p_year, t_cap, t_hh, t_rd, t_rsa, t_ttlh]
  count:
    pipeline: filtered
    transforms:
      - type: count
      - type: rename
        columns:
          case_id: Count
  sum:
    pipeline: filtered
    transforms:
      - type: columns
        columns:
          - t_cap
      - type: sum
      - type: eval
        expr: "Capacity = table.t_cap / 10**6"
layouts:
  - title: Overview
    layout: [[points, [count, capacity]], [table, [cap_hist, year_hist]]]
    sizing_mode: stretch_width
    views:
      points:
        type: hvplot
        kind: points
        pipeline: windturbines
        x: easting
        y: northing
        c: $variables.color_by
        tiles: ESRI
        rasterize: true
        dynspread: true
        responsive: true
        height: 500
        xaxis: null
        yaxis: null
        streaming: true
        selection_group: windturbines
      table:
        type: table
        pipeline: table
        header_filters: true
        sizing_mode: stretch_width
        height: 500
        page_size: 20
      count:
        type: indicator
        indicator: number
        pipeline: count
        field: Count
        format: '{value:,}'
        width: 300
        default_color: white
      capacity:
        type: indicator
        indicator: number
        pipeline: sum
        field: Capacity
        format: '{value:.0f} TWh'
        width: 300
        default_color: white
      cap_hist:
        type: hvplot
        kind: hist
        pipeline: windturbines
        y: t_cap
        frame_width: 400
        height: 250
        selection_group: windturbines
      year_hist:
        type: hvplot
        kind: hist
        pipeline: windturbines
        y: p_year
        frame_width: 400
        height: 250
        selection_group: windturbines

